

Landing Page Traffic Reporting Using Google Analytics 4
If you have a business website, you may wonder which pages your site visitors go to first. The data can help you boost traffic, engagement, and conversions. So, in this article, let us teach you how to create a landing page traffic report using Google Analytics 4 (GA4).
Landing Pages are web pages made for specific marketing campaigns, as they have a particular Call-To-Action that leads your target audience to a sale. So, for instance, your Social Media page or website links to your Landing Page. Then, it redirects people to your Landing Page. Thus, these pages are perfectly positioned to help a Customer Journey along.
It’s vital to create Conversion-Optimized Landing Pages. The best pages use Psychological Design Principles. However, it’s also essential to see how well your Landing Page is faring.
As a result, you need to use Google Analytics 4 or GA4. Read more and find out how to use it for best results!
The importance of Analytics
Increasing sales leads and customer acquisition are top objectives for many marketers. So, naturally, it is crucial to create an effective marketing plan and execute it. But, you have to account for what happens after! You must sustain your Marketing efforts, and so you need analytics.

Analytics “predict consumer behavior [and] improve decision-making.” Marketers can apply insights from analytics reports. From such reports, you can see how well your pages are doing.
But on the other hand, you may also find holes or problems in your site. That is, you see if anything needs adjustments or fixes. Knowing these can significantly boost your pages’ health!
Thus, you need Google Analytics to improve your Landing Pages. With time, you’ll be boosting conversion rates while lowering bounce rates!
How to Create Landing Page Traffic Report with GA4
You need a Google Analytics account to create reports and analyze webpage performance. So, if you don’t already have an account, you have to make one first. On the other hand, head to your dashboard if you already have one. Here you’ll see the dimensions and metrics of your Landing Page in Google Analytics.
Reports Snapshot
On your Analytics dashboard, you will first see the “Reports snapshot,” which details Landing Page metrics such as Users, New Users, Average engagement time, and Total revenue within a set period.

The snapshot also indicates the following reports:
- number of users who visited your site in the last 30 minutes
- number of users you have per minute
- where your users come from
- top campaigns
- trend of your active users
- how well you retain your users
- pages and screens that get the most views
- top events
- top conversions
- top-selling products
Engagement: Pages and Screens
Now, let us discuss how to create a report on your landing page traffic using Google Analytics.
First, on the “Reports” tab located on the left side of the screen, select “Engagement.” The engagement reports show what visitors do on the website. The information includes the pages that page visitors view.
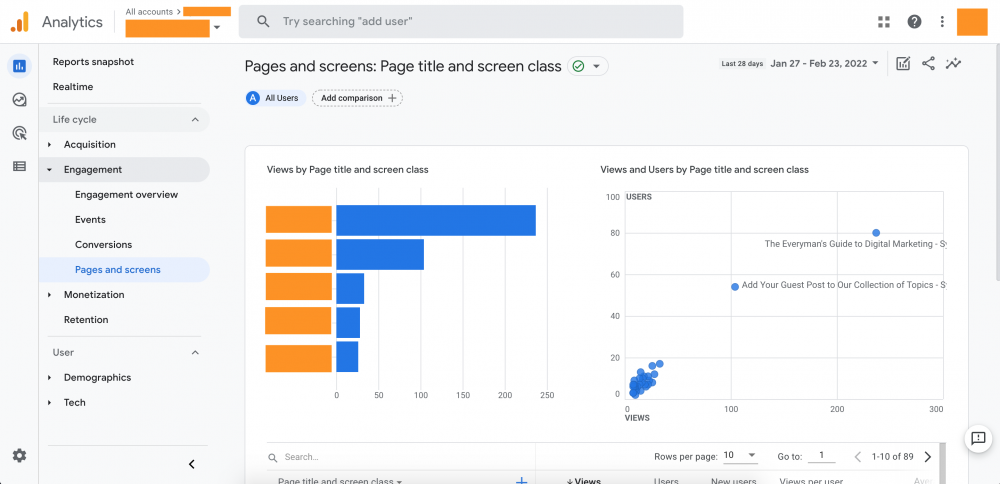
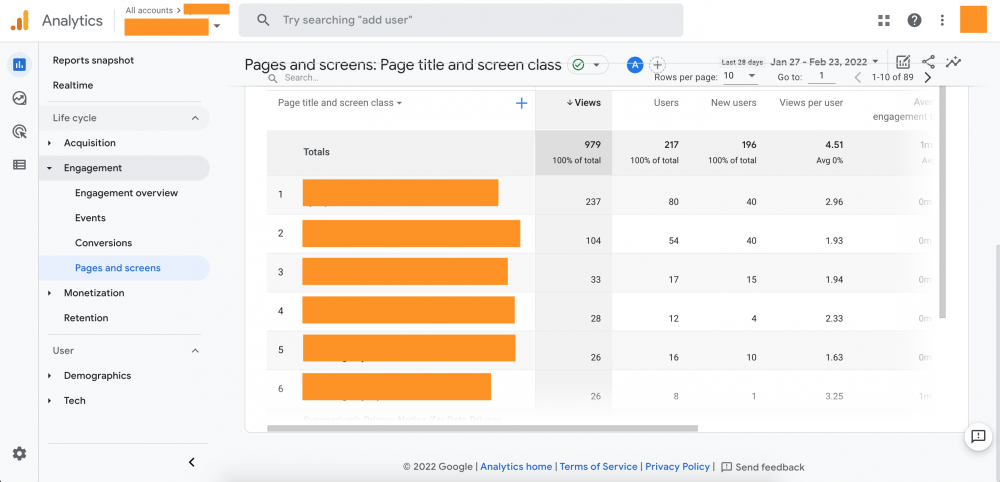
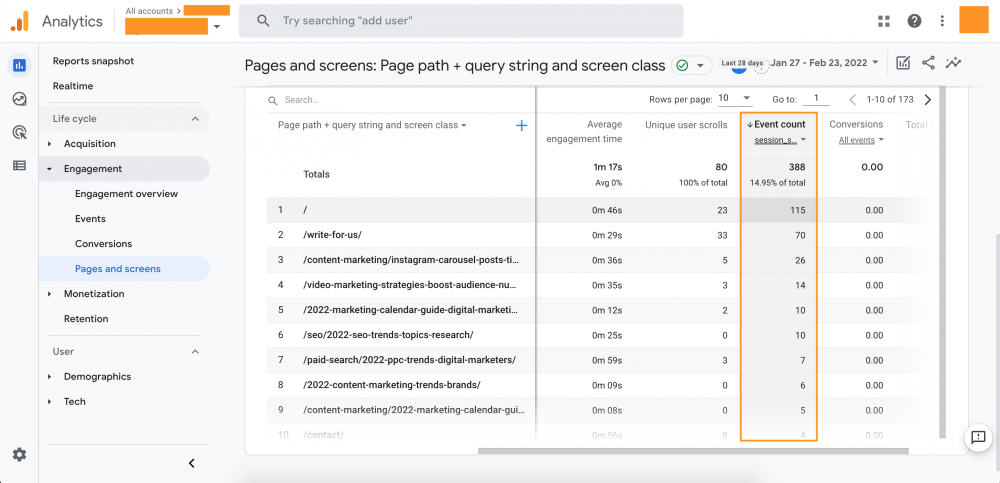
After that, click on “Pages and screens” to see the different pages that site visitors engage with. However, you may notice that the report presents this by “Views” (as shown below). Now, you must see which landing pages are most visited.
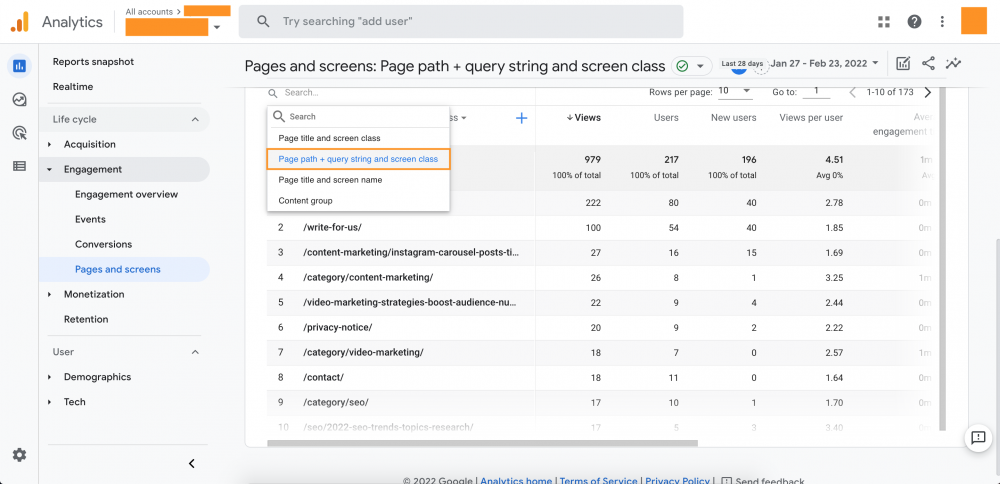
Moreover, the report displays your pages based on the title by default, so let us change this to the page URLs. To do this, head to the dropdown button that says “Page title and screen class” and change it to “Page path + query string and screen class” (as shown below). Doing so will list the pages according to their URLs.
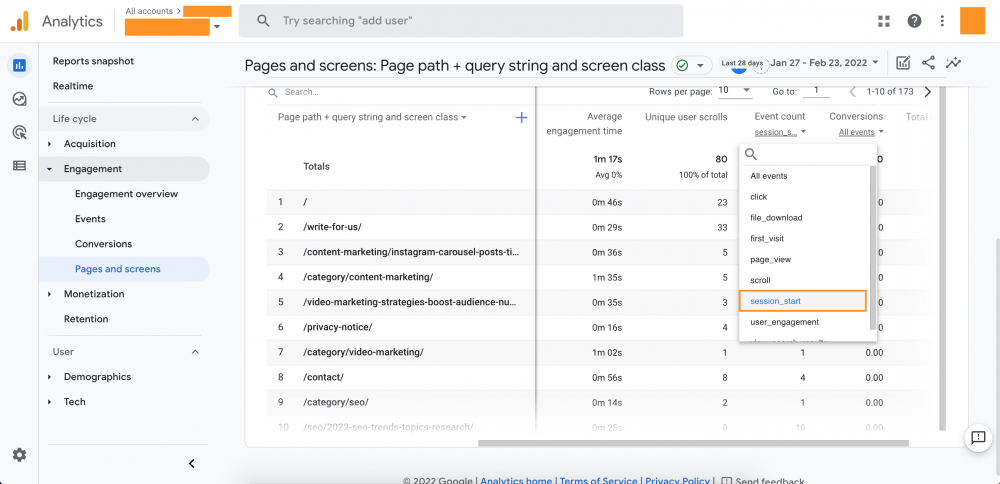
However, you still see your pages according to views, so let’s change that. First, scroll to the right and click on “All events” under the “Event count” column, and choose “session_start” (as shown below).
Upon doing this, you will see the pages that site visitors view as they start a session on your website. This means that you can now see which pages site visitors view first—your landing pages.
You can reorder the information so that the report displays your top-performing landing pages first, then click on the “Event count” column (as shown below).
Creating Your Landing Page Report
You can also use Google Analytics 4 to create a customized landing page traffic report. To see your custom reports in Google, click on the “Explore” tab on the left side of the screen. Doing so will show you the “Explorations” dashboard (as shown below).
To create custom reports for traffic, select “Free form.” This will start a new exploration.

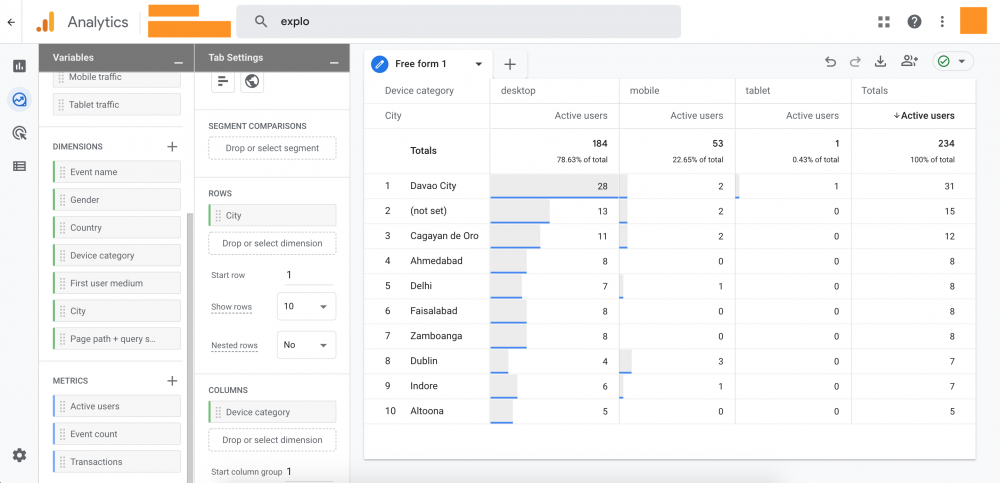
Once you do that, GA4 will display a default report, which you can rename and customize. For example, as shown below, the “Free form 1” report displays information (active users) considering the following metrics: Device category (columns) and City (rows). You can create a new free form report by clicking on the plus button beside the table’s title.
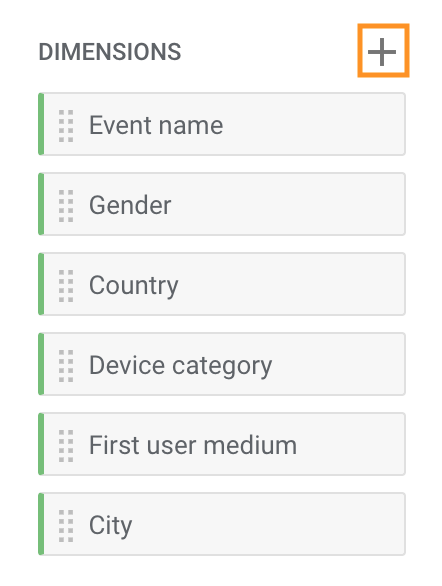
So, to create your traffic report, click on the plus button (as shown below) next to the “Dimensions” section. It’s located on the left side of the screen.
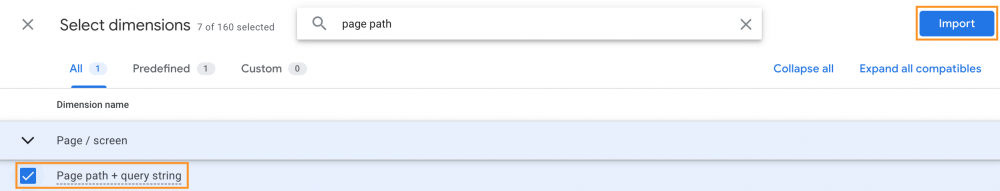
After that, Google Analytics will show a list of dimensions that you can choose. Scroll down or use the search bar to locate the “page path + query string” dimension. Enable the dimension by ticking the box beside it, then click on the “Import” button.
Next, you must remove the existing row (City) in the “Rows” section. Then, drag the “page path + page query” dimension from the “Dimensions” section and drop it into the “Rows” section (as shown below).
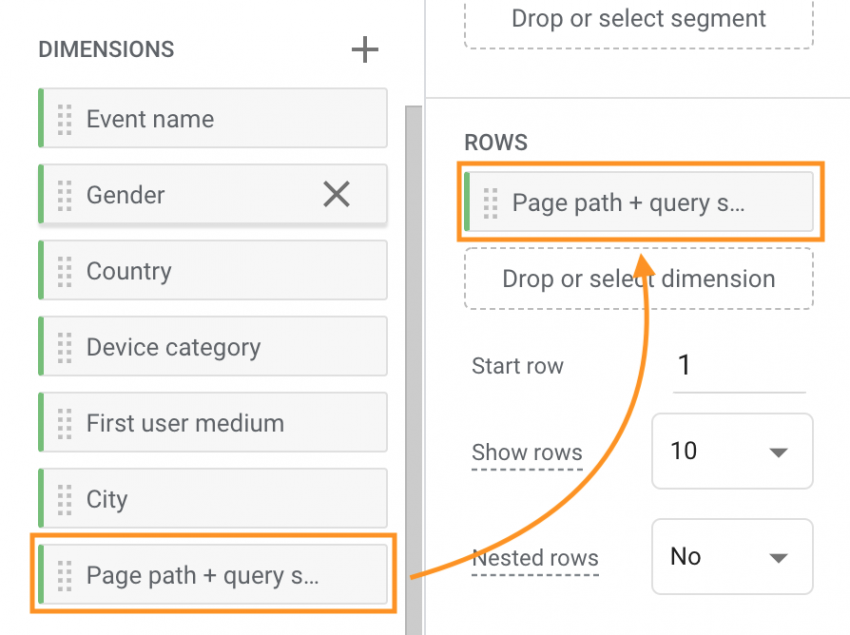
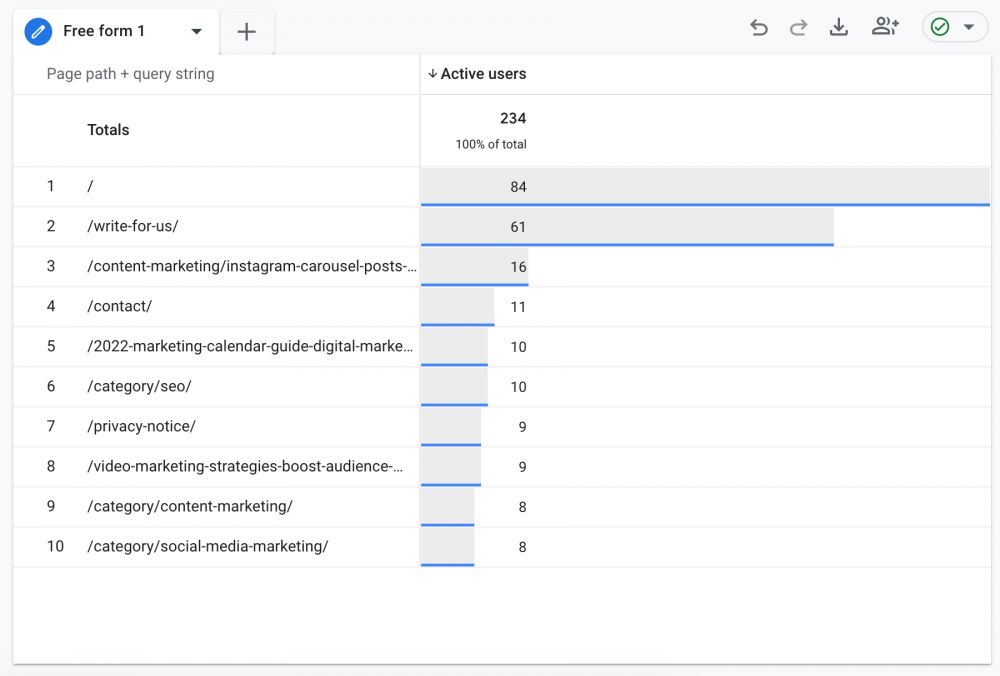
Now, you will see that the report will display a list of your landing pages and their respective number of active users.
Customizing Your Report Further
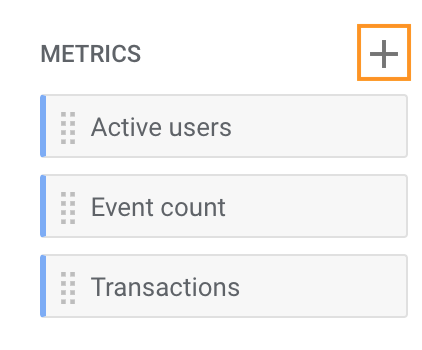
We can further customize the report that you created. So to add more metrics, click on the plus button beside the “Metrics” section.
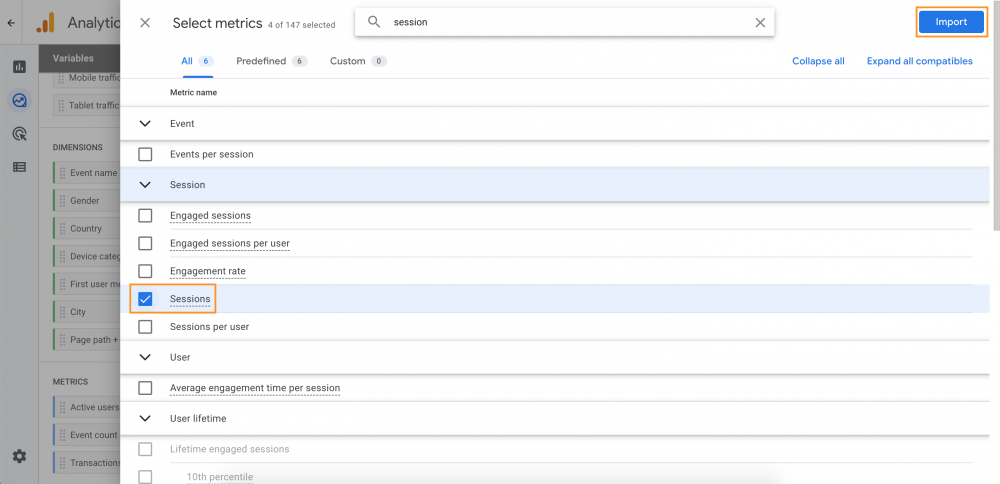
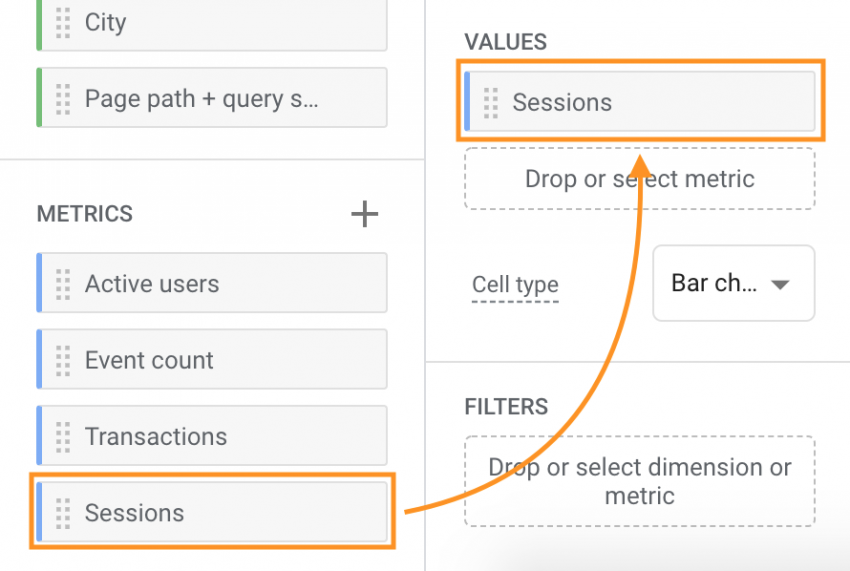
After clicking the button, GA4 will display a list of metrics to choose from. Scroll down or use the search bar to find the “Sessions” metric. Enable the metric by ticking the box beside it and clicking on the “Import” button.
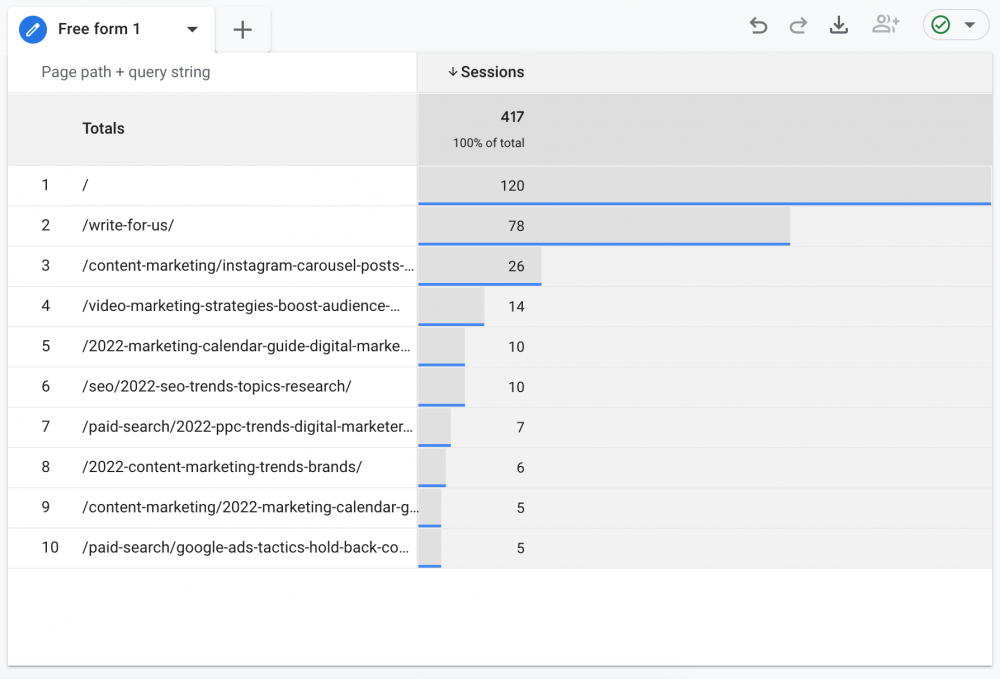
Similarly, drag the “Sessions” metric from the “Metrics” section and drop it into the “Values” section (as shown below).
After doing so, you may now see your top landing pages.
You can customize the report further by adding more metrics, such as “Engagement Rate,” “New Users,” and “Conversions.”
Create Your Landing Page Traffic Report Now!
Now you know how to use Google Analytics 4 properties to create a landing page traffic report for your business website. Of course, to boost traffic, you can always apply Website Redesign Tips to your Landing Page. Additionally, if you need help, you can even take on some Landing Page Builders.
However, Landing Pages are explicitly made to call potential customers to act on a CTA. Thus, it is vital to monitor your Landing Page analytics. Metrics are valuable in refining your marketing strategies. You can create a Google Analytics report for helpful insights.
With GA4, you can figure out the number of Landing Page visitors, engagement time, and revenue! Also, you can check out your top campaigns, user retention, and best-selling products!
A Digital Marketing Company in the Philippines can check your web performance. In addition, they can assist you with Google Analytics 4, especially if you have any questions!
About Jalou Batilong
Most every great writer is a voracious reader, and no word describes Jalou better. Jalou enjoys a good read whenever she has the time to sit down and open a book or browse for interesting articles. It's through reading that she is able to digest information so easily, and write her own unique piece of information to share to everyone else.
- Find more about me on:


Related News:


Choosing a Custom Software Development Company

Software Development Team Roles and Responsibilities


What Tools Do Web Designers Use?


Comment 0