

Inventory Analysis Methods: Types and Benefits
A thorough inventory analysis helps businesses determine the right amount of stock to keep while considering customer demand. Inventory analysis methods can help you examine your stock more effectively and avoid costly guesswork.
The inventory analysis process helps businesses avoid overspending on storage. That said, you’ll need a balance sheet to analyze the carrying costs of goods sold, on hand, and on order. Systematic, real-time analysis of your inventory levels is essential, and comprehensive analysis methods help you better control stock as your business grows.
Below, we break down some of the most common inventory analysis methods, how to apply them, and the benefits each one offers.
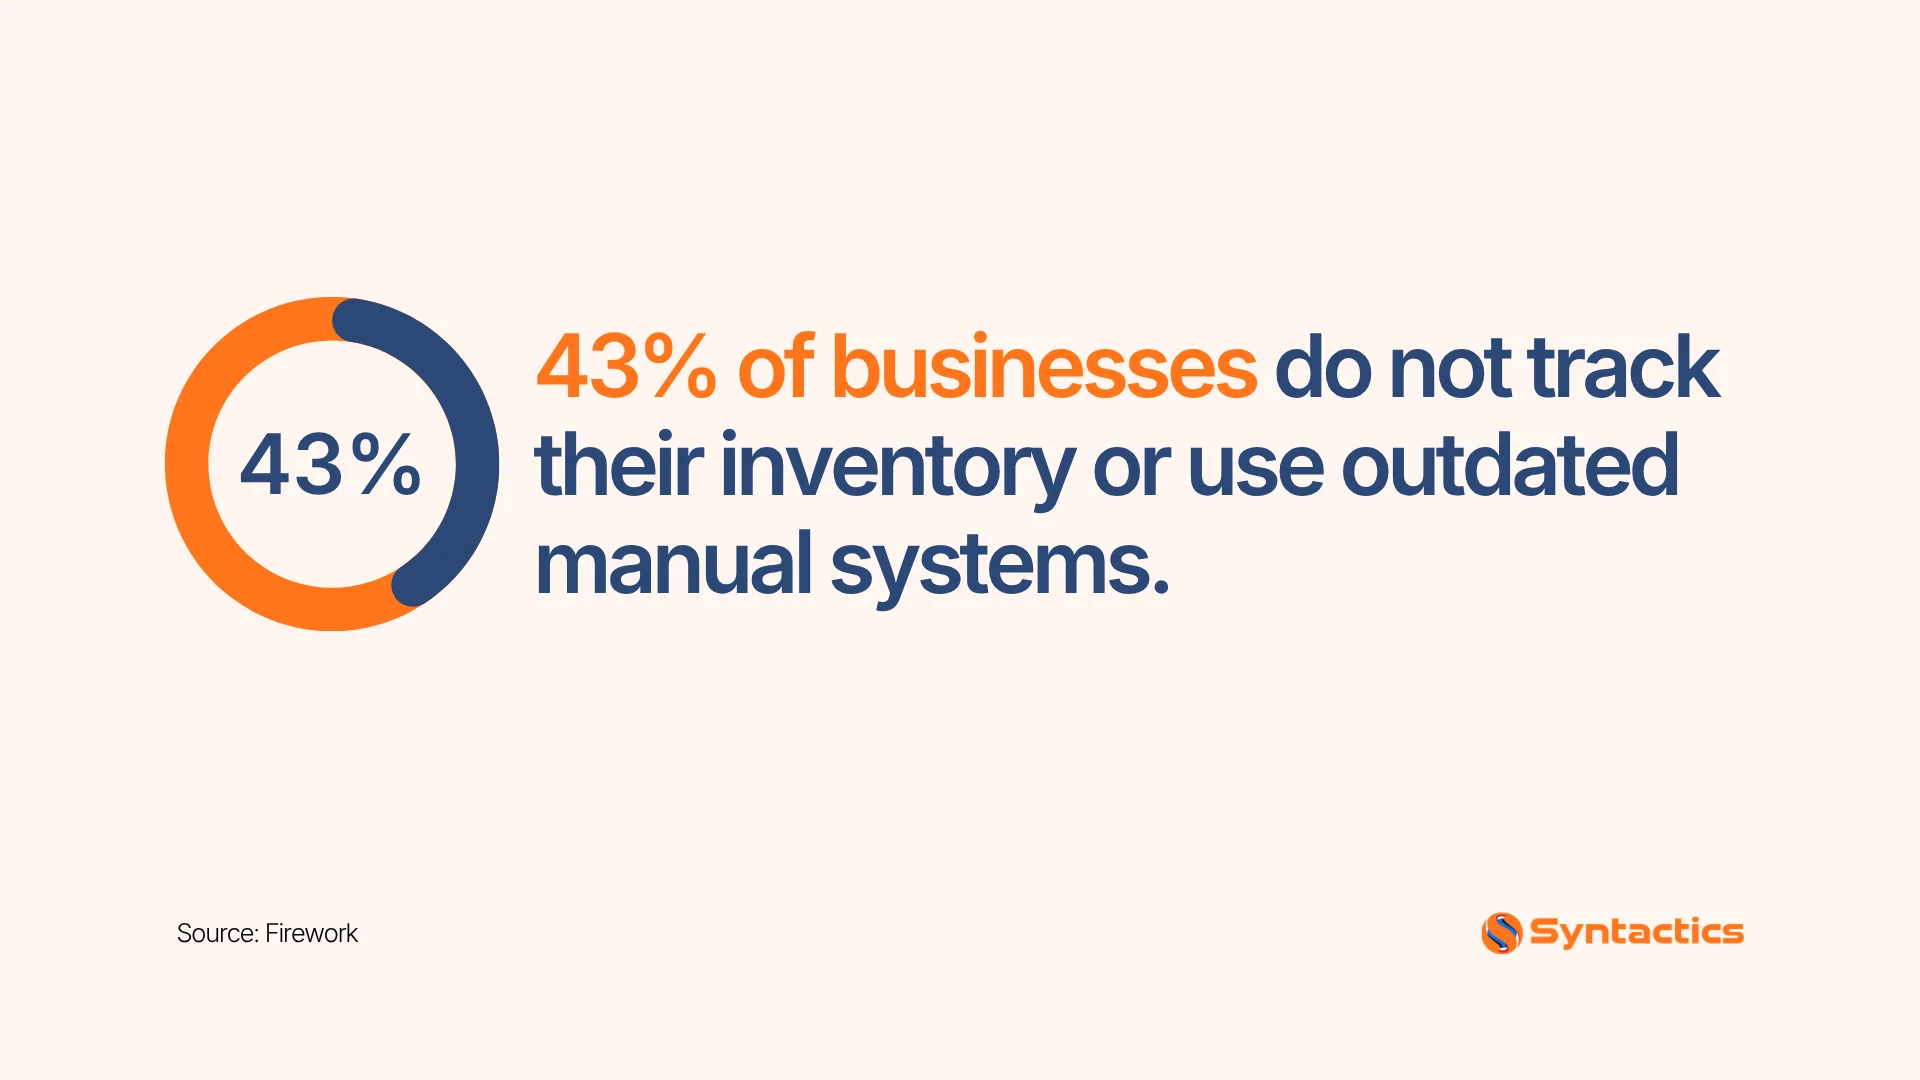
Source: Zippia.
What Are the Benefits of Inventory Analysis?
When you analyze inventory, you open the door to a better Return on Investment (ROI). ROI shows whether a company is meeting its financial targets and whether certain operations still make sense.
Inventory analysis also helps significantly reduce lost sales. By identifying the inventory stock levels worth keeping on hand, you can focus on the goods or products most likely to sell. In turn, this helps increase customer loyalty, since you’re better positioned to provide the products customers actually need.
Here are other ways analyzing inventory helps your business:
- Establishing a proper warehouse layout
- Reducing lead time in acquiring raw materials and sellable items
- Implementing proper authorization controls
- Ensuring accurate item classification for better cost management
- Adequately managing dormant inventory items
- Improving utilization of capital
- Improving cash flow and profit margins
- Identifying future opportunities or potential losses early
Inventory analysis methods are crucial to your business because they inform your inventory manager’s decisions on protecting valuable assets. Inventory analysis, management, and product classification work together to help you build stronger policies for inventory control. Many businesses also use an online inventory management system to streamline these workflows further.
What Common Inventory Analysis Methods Can I Use?
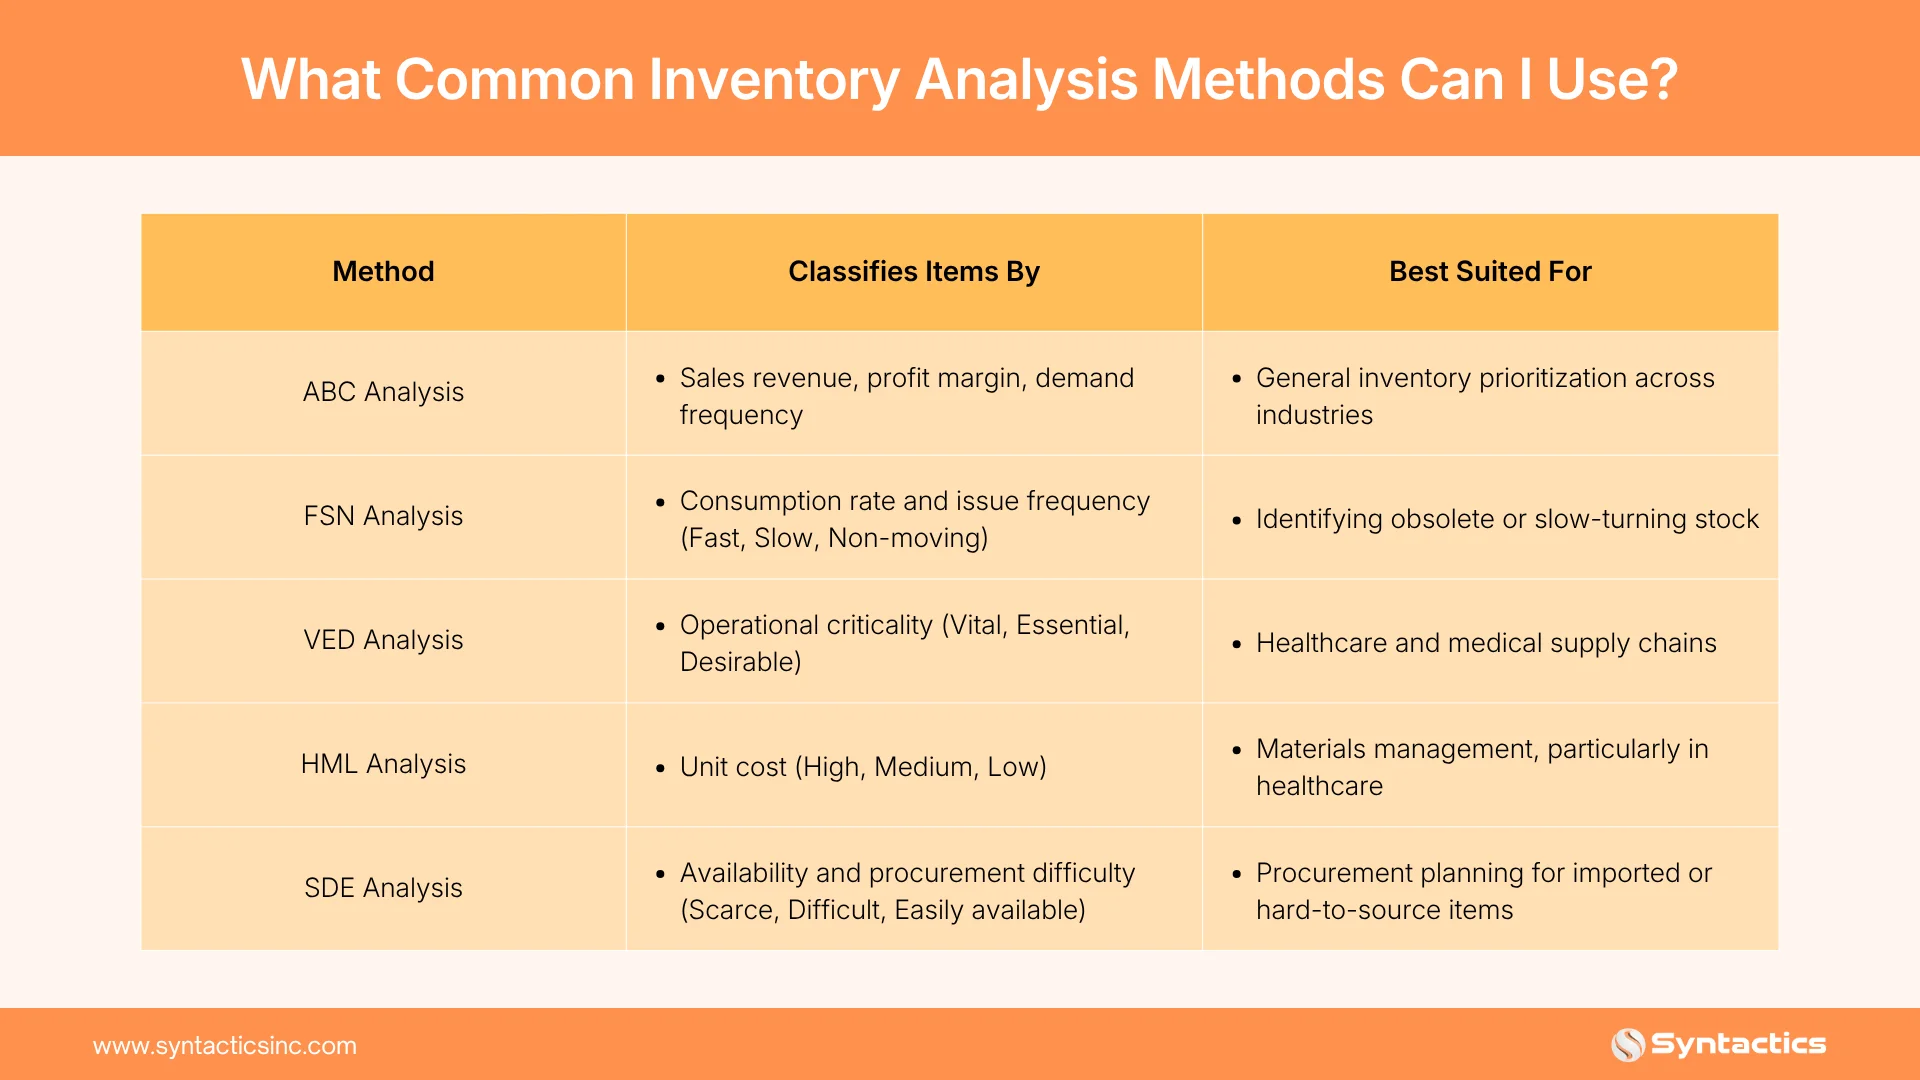
There’s no single “correct” way to analyze inventory; the right method (or combination of methods) depends on your industry, product mix, and business priorities. Here’s a quick comparison before we go through each one in detail.
ABC Analysis
The ABC analysis method categorizes items into A, B, or C groups based on sales revenue, profit margins, and demand frequency. Here’s a quick breakdown of the groups:
- Category A — High-Priority, High-Value: High-priority, in-demand products fall under this category. They typically account for 10% of the total inventory on hand but contribute 70% of the total consumption value.
- Category B — Medium-Priority, Moderate-Value: These stocks account for roughly 20% of total inventory, contributing about 20% of the total consumption value.
- Category C — Low-Priority, Low-Value: These low-demand items make up around 70% of total inventory but only 10% of the total consumption value.
It’s important to periodically review and update the analysis to reflect changes in the market and business priorities.
How the ABC Analysis Works
The ABC inventory analysis method classifies items by annual consumption value. Inventory managers often apply the Pareto Principle here, since a small portion of items typically accounts for most of the consumption value, while the majority carry comparatively minor significance.
This approach helps organizations allocate resources efficiently by prioritizing critical items over less important ones. You can supplement ABC analysis with the XYZ analysis, which forecasts how difficult an item is to sell: “X” items are easier to sell, while “Z” items are the most difficult to move.
How to Do an ABC Analysis of Inventory
ABC analysis can improve inventory management, reduce costs, and improve customer service. Here’s what to do:
- Gather data about each item, such as revenue and profit margin.
- Sort and rank the items based on their annual usage value.
- Divide the sorted list into A, B, and C categories.
- Apply strict inventory control for Category A items, moderate attention for Category B, and lighter management for Category C.
- Regularly review your stock to account for changes in market conditions.
- Use inventory management software to automate reporting and keep your analysis up to date.
Source: Grand View Research
FSN Analysis (Fast-, Slow-, and Non-Moving Inventory)
The FSN analysis method looks at how quickly, or slowly, items move out of inventory:
- Fast-Moving: Items that are frequently issued or used, with a high turnover rate.
- Slow-Moving: Items issued or used less often over a given period. These have relatively lower demand than fast-moving stock and tend to remain in inventory longer, requiring careful management to avoid overstocking or obsolescence.
- Non-Moving: Items not issued or used for an extended duration. These carry very low or no demand and may need to be liquidated, discounted, or disposed of.
What Is FSN Analysis?
FSN analysis in inventory management classifies inventory based on quantity, consumption rate, and frequency of issues and use. It helps optimize inventory levels and improve overall management strategy. Other benefits include:
- Optimizing inventory levels
- Managing capital more effectively
- Reducing holding costs
- Minimizing obsolescence
- Improving customer service
How to Do an FSN Analysis
- Gather historical data on the past year’s sales, consumption, and inventory levels.
- Determine thresholds for each category.
- Categorize items into Fast-, Slow-, or Non-moving based on those thresholds.
- Use spreadsheets or inventory management software to automate categorization, listing each item, its sales or consumption data, and the formula used to determine its threshold category.
- Regularly review and refine the analysis as market conditions change, and act on it to maintain an optimal inventory mix.
Tailor this analysis to your business, and revisit your categorization criteria periodically to stay responsive to changing market conditions.
Source: ShipStation.
VED Analysis (Vital, Essential, and Desirable)
The VED analysis method organizes items into three categories:
- Vital: Inventory you need to keep in stock consistently, since it’s indispensable to operations. In a healthcare setting, for example, not having these items on hand can result in life-threatening situations.
- Essential: Keeping a minimum supply is enough, as these items are often needed for emergencies. Stockouts are unacceptable given their importance, though they’re not as critical as vital items.
- Desirable: Convenient but optional or non-critical items. Operations can continue with or without them, and their unavailability won’t pose an immediate threat.
What Is VED Analysis?
VED analysis is used primarily for inventory control in healthcare and medical supply chain management. As an inventory analysis method, its classification depends heavily on the user’s experience and judgment, ranking inventory by relative importance, similar to how spare parts might be prioritized.
VED analysis helps organizations focus on vital items while minimizing effort and cost spent on less critical ones. This categorization matters most in healthcare, where patient outcomes depend on the availability of medications, medical equipment, and supplies. It helps organizations prioritize procurement and management of materials to ensure uninterrupted operations.
For best results, pair VED analysis with other techniques, like ABC analysis, as part of a broader inventory strategy.
How to Do a VED Analysis
- List all items to be identified and analyzed.
- Collect data on item usage, operational impact, and the consequences of unavailability.
- Define criteria for categorizing items into VED categories.
- Assign items to their proper classification.
- Prioritize management and procurement efforts based on that categorization.
- Regularly review and update the categorization as requirements or situations change.
- Incorporate findings into materials management and inventory control processes.
HML Analysis (High, Medium, and Low)
The HML analysis method lists products or items under the following classifications:
- High Cost: Items with high unit value that are critical to operations. Unavailability can cause significant disruptions, so businesses should maintain a constant supply.
- Medium Cost: Items with medium unit value. Unavailability causes disruptions but isn’t immediately critical.
- Low Cost: Items with low unit value. These are non-critical, so a lack of supply is, at most, an inconvenience.

What Is HML Analysis?
HML analysis is a valuable approach to categorizing inventory by a product’s unit price. It’s often used in materials management and inventory control for healthcare and medical supplies, sorting items into High, Medium, and Low priority based on their impact on business operations.
This approach minimizes the effort and cost associated with low-priority items.
How to Do an HML Analysis
- Identify all the items or materials you want to analyze.
- Gather data on each item, including usage, operational impact, and consequences of unavailability.
- Define the criteria for categorizing items into HML categories.
- Assign items to the appropriate categories.
- Create a document to record item categories.
- Prioritize your management and procurement efforts accordingly.
- Regularly review and update the categorization as needed.
- Incorporate the findings into your inventory management processes.
SDE Analysis (Scarce, Difficult, Easily Available)
The SDE analysis method classifies items as follows:
- Scarce: Usually imported items that require a longer lead time and are often hard to find. Managing these requires strategic planning and higher stock levels.
- Difficult: Items more available than scarce ones, typically requiring more than two weeks but less than six months lead time.
- Easily Available: Readily available items, abundant in the market, requiring only standard inventory control measures.
What Is SDE Analysis?
SDE analysis classifies materials based on availability and procurement difficulty. It helps prioritize items and allocate resources by considering whether a material is freely available or scarce and how many days of lead time it requires.
How to Do an SDE Analysis
- Identify all the items to analyze.
- Collect data on each item, such as availability and procurement characteristics.
- Define the criteria for categorizing items into SDE categories.
- Review items and assign them to one of the categories.
- Create a document or spreadsheet to record each item’s categorization.
- Prioritize your management and procurement efforts.
- Regularly review and update the categorization as needed.
- Incorporate the findings into your inventory management processes.
For custom-fit inventory management workflows, check out our roadmap to modern business app development.

Test Out These Inventory Analysis Methods
There are plenty of ways to make inventory management more efficient, and these inventory analysis methods can help your business gain better control over stock, costs, and customer satisfaction. Consider pairing them with a reliable online inventory system to further streamline your materials management workflows.
Choose the analysis method that best fits your business, or work with a business applications software team for professional support. Done right, this doesn’t just improve how efficiently you manage inventory; it also strengthens your ROI over time.
Need help implementing an inventory analysis system? Syntactics, Inc. specializes in custom business applications, including inventory management solutions built around how your business actually operates. Get a free quote to discuss your project.

This article was updated on September 18, 2026.
Frequently Asked Questions
What Is Business Inventory Analysis?
Inventory analysis is a process that examines the mix of business processes while accounting for the demand for specific products.
What Are the Main Benefits of Inventory Analysis?
Inventory analysis helps business managers decide how to protect valuable assets. It also improves inventory control policies and contributes to a better Return on Investment (ROI).
What Are the Other Benefits of Inventory Analysis?
The benefits of conducting a business inventory analysis include:
- Reducing lead time in acquiring sellable items
- Proper item classification to improve cost management
- Better management of dormant inventory items

About Xenia Labis
Related News:

The Importance of a Project Management Timeline


WordPress 6.8 Cecil is Here! Explore the Key Updates









Comment 0