

How to Analyze LinkedIn Campaign Performance
Professionals and employers can advertise on LinkedIn using Campaign Manager, the networking platform’s all-in-one advertising tool. Now that you have already tried out creating your ads on LinkedIn, the next thing to do is see if your ads are working as expected. Let us discover how to analyze LinkedIn campaign performance through Campaign Manager.
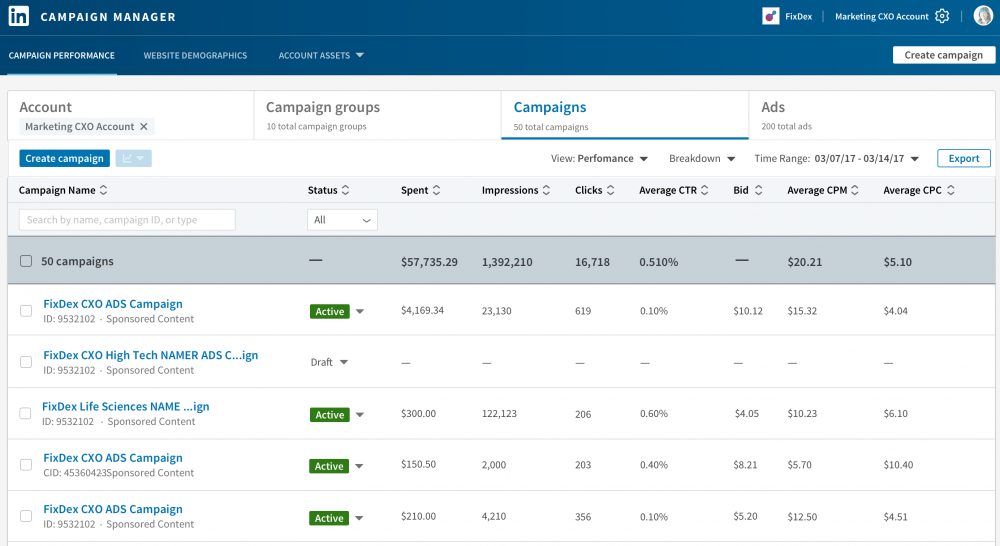
Image Source: LinkedIn
Analyze Campaign Performance with Campaign Manager
After creating ads and publishing them on your LinkedIn account, you can start using Campaign Manager to generate reports. These reports provide analytics showing your ad campaign’s performance based on the metrics that you have previously set while creating the said ad. As such, you can use these reports to analyze your LinkedIn ad campaign and identify areas that need modification. As a result, you can improve ad performance and, ultimately, your return on investment (ROI).
With the use of your Campaign Manager, you can gain access to your campaign data. On the Campaign Manager dashboard, you can see the accounts, campaigns, and ads affiliated with your LinkedIn profile.
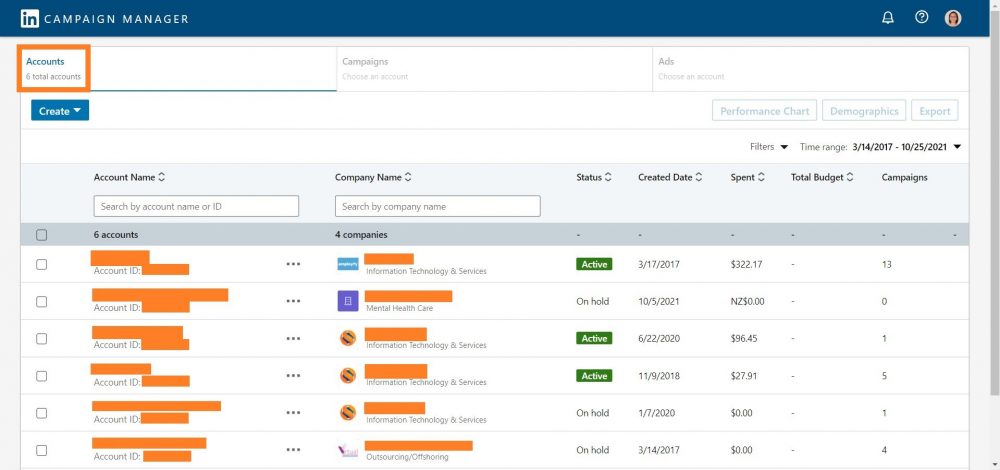
Accounts
Under Accounts, you can see (in columns) the account names and their respective companies, status (such as “Active” or “On hold”), the dates they were created, how much you spent on them, your total budget, and their respective number of campaigns created.
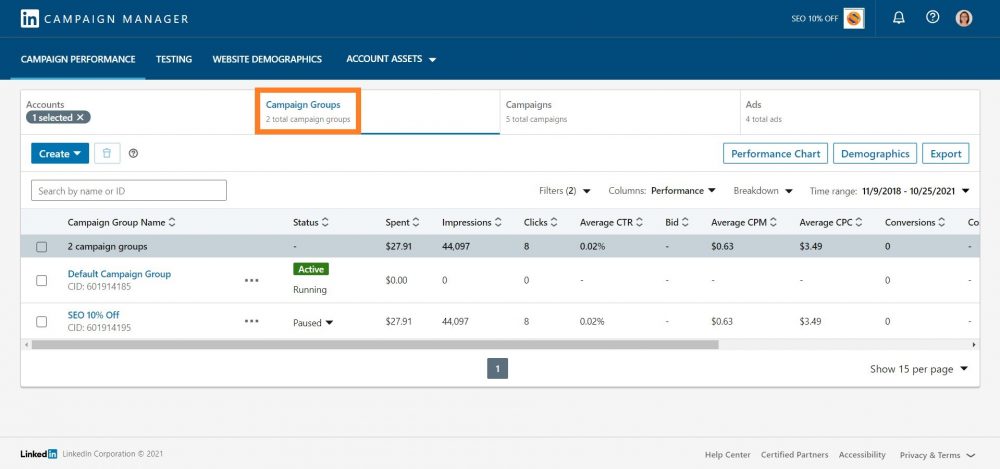
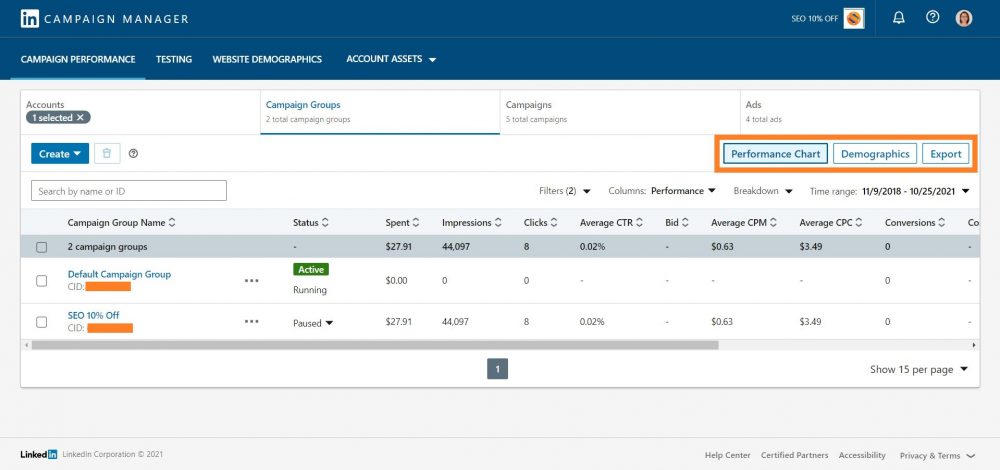
Campaign Groups
Under the Campaign Groups tab, you will see the campaigns that you have created. You will see the campaign group’s status and how much you spent for each campaign group. You can also see their respective key results, cost per result, impressions, clicks, average CTR, bid, average CPM, average CPC, Conversions, Cost per Conversion, Leads, Cost per Lead, and Event Registrations.
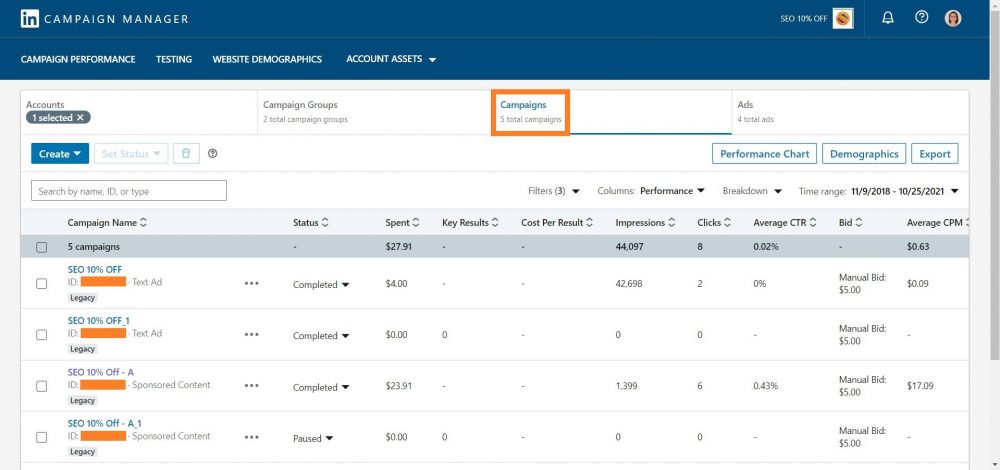
Campaigns
Under the Campaigns tab, you will see the campaigns that you have created. Then, you will see their status, how much you spent for each campaign, their respective key results, cost per result, impressions, clicks, average CTR, bid, average CPM, average CPC, Conversions, Cost per Conversion, Leads, Cost per Lead, and Event Registrations.
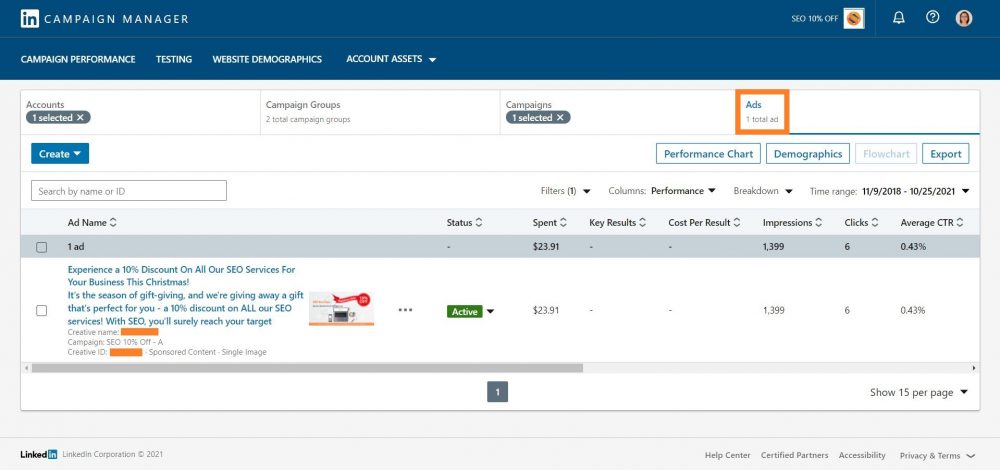
Ads
Under Ads, you can see the performance of your ads and their respective status. Much like your campaigns, under this tab, you can see how much you spent for each ad. Then, you can also see their respective key results, cost per result, impressions, clicks, and average CTR. Aside from that, you will see the bid, average CPM, average CPC, Conversions, Cost per Conversion, Leads, Cost per Lead, and Event Registrations.
Reports
Finally, you can also generate and download CSV reports that will help you evaluate your campaign’s performance using detailed performance metrics.
Here are the various CSV reports that you can download through Campaign Manager:
- Performance Chart: You can choose the metrics to download regarding your ad and campaign performance from the default or custom column views.
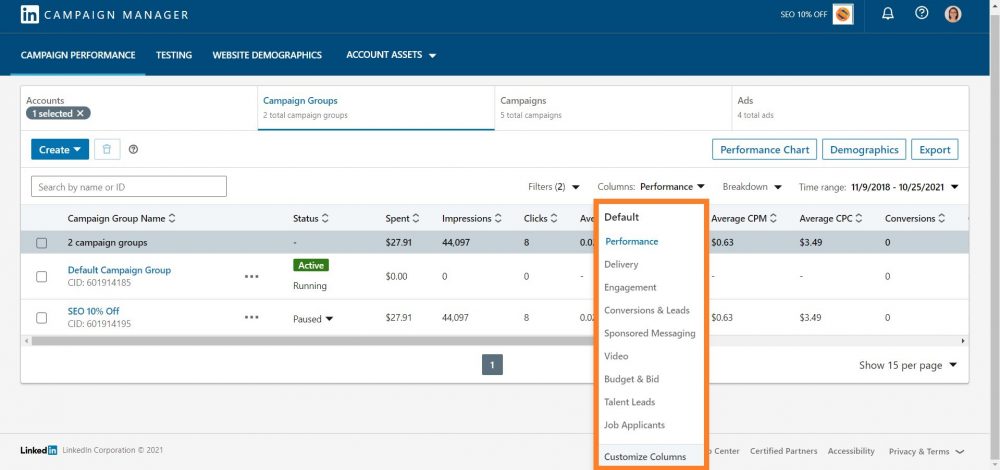
- Audience Network Performance: With this report, you can compare the performance of your ads that LinkedIn showed on their platform with those that they displayed on their partner apps or websites.
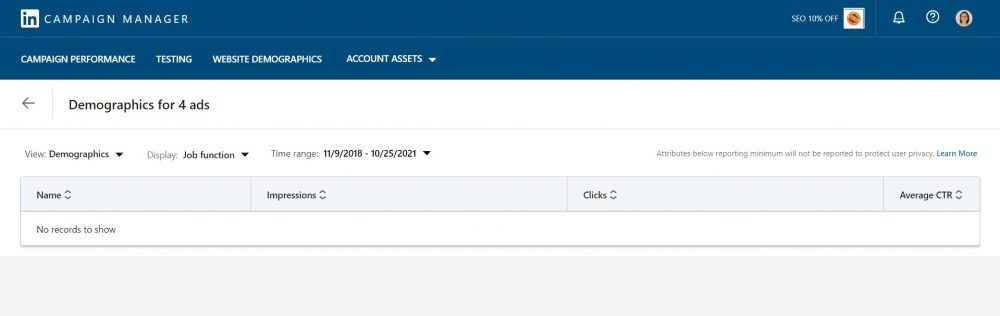
- Demographics: This report allows you to see information regarding the users who interacted with your ads and campaigns.
- Conversion Performance: Through this, you can compare the types of conversions you have received through your ads and campaigns.
- Leads: In this report, you can see user responses to the Lead Gen Forms linked with your campaigns.
- Conversation ad CTA Performance: Here, you can see how many clicks you have received for each action in your conversation ad.
Here’s how you can download a CSV report:
- First, sign in to Campaign Manager and choose the correct accounts, campaign groups, campaigns, or ads. After that, use the tabs at the top of the page to select the right account level.
- Then, choose individual accounts, campaign groups, campaigns, or ads through the checkmark boxes (left side of the page). After that, set the Time range.
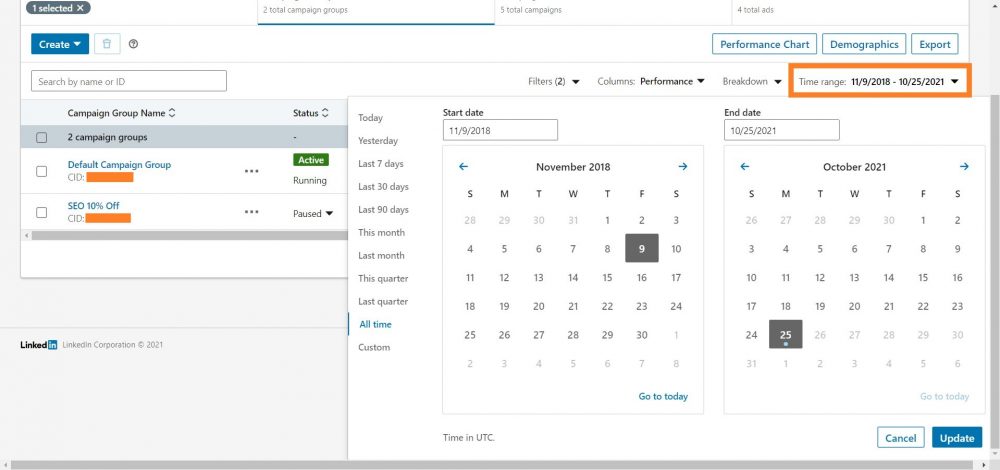
- Click the “Export” button, and a pop-up window will appear. Then, here, you will need to choose a Report Type. You then have the option to select the columns to include in your report: all columns, a default column view, or a custom column view.
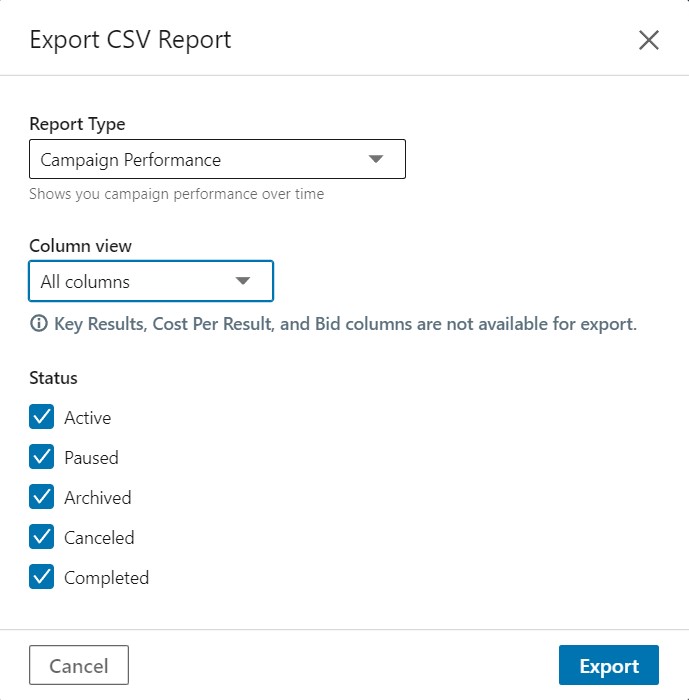
- Then, choose your preferred Time breakdown for the report (daily, monthly, or all). Once done, you can click the “Export” button.
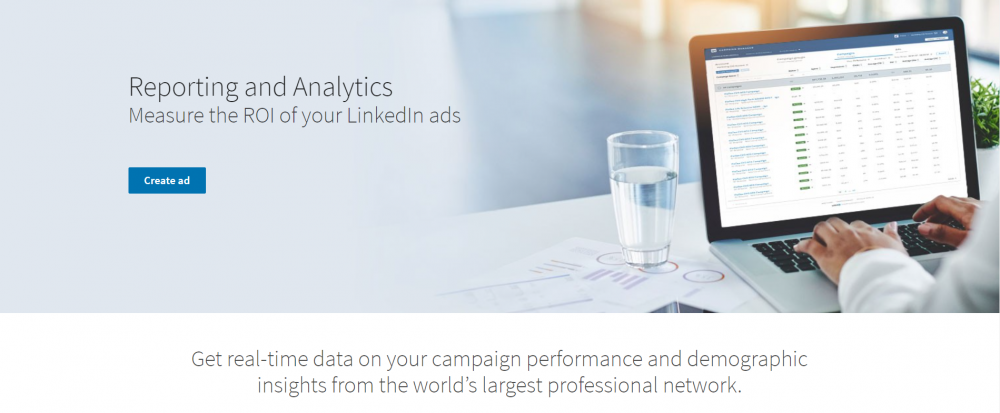
Image Source: LinkedIn
Analyze Your LinkedIn Campaign Performance Now!
With these reports, you can determine areas in your ad or campaign that need improvement. As a result, you can figure out how to resolve the issue and enhance its performance to get better results in the following cycles.
Thus, if you need someone to help you manage and analyze your LinkedIn Campaign performance, you can always reach out to a company that offers PPC management services. They can assist you and even teach you how to make the most of your LinkedIn account!
Have we missed anything in our discussion? Please share with us in the comments section below should you have questions or concerns!
About Jalou Batilong
Most every great writer is a voracious reader, and no word describes Jalou better. Jalou enjoys a good read whenever she has the time to sit down and open a book or browse for interesting articles. It's through reading that she is able to digest information so easily, and write her own unique piece of information to share to everyone else.
- Find more about me on:


Related News:


Competitor Analysis Factors to Consider


Comment 0