
Google Sheets Features for Project Managers
Taking advantage of Google Sheets
Efficiency is everything when it comes to project management. Organizing tasks, doing time management, and tracking progress on spreadsheets will be a headache without using proper management tools.
In our company, we do take advantage of Google applications like Google Docs that are readily available and are effective. This way, we take our capabilities to the next level while addressing our production needs at a minimum cost for our clients.
Amazingly, Sheets offers a wide variety of features and templates that project managers can use to create trackers and analyze data for decision-making purposes. Additionally, because Google Sheets is an online tool, your work will be automatically saved; saving you from the possibility of losing your data due to power interruptions.
For this article, we’ll focus on Sheets and how it can help you manage your project.
Source: GSuite Marketplace
Accessing the Google Sheets application
Following these best practices should be able to make you and your team work more efficiently and reduce the chance of human errors in handling data.
Additionally, good practice adds value to your team’s or client’s workflow process and creates a positive habit for the team.
Firstly, you need to have a Google account or email address. If you already have one, open your browser and navigate to sheets.google.com on the Address bar.
Sign in and you should be able to see something like this:
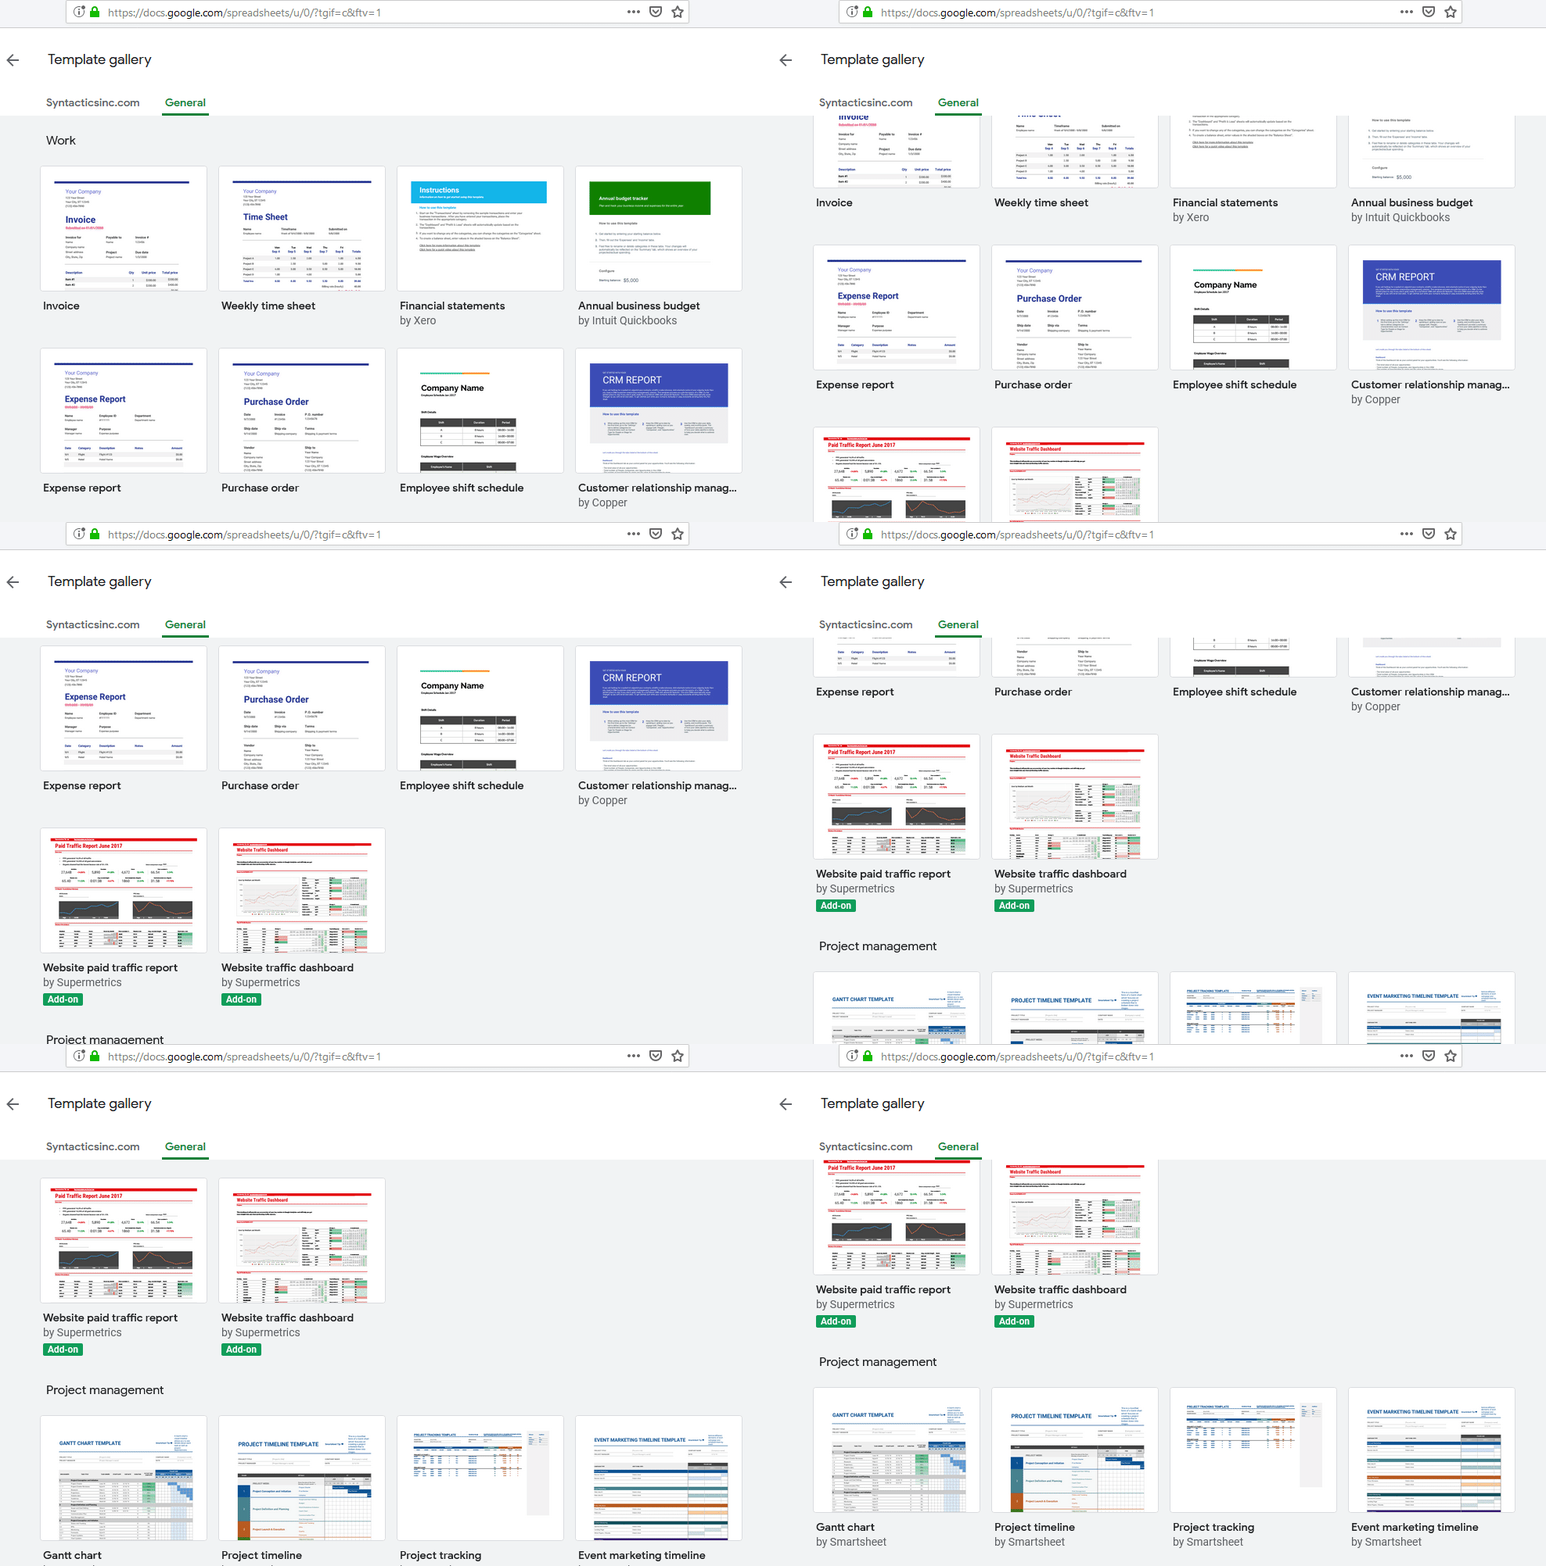
Click on the template gallery button and you’ll be redirected to the list of spreadsheet templates provided by Google for work, personal, project management and other categories.
Remember, you can customize, create new spreadsheets, and edit these templates to whatever suits your project best. You can also work on them on the Sheets app for mobile devices.
Available Google Sheets templates for Project Managers
- Gantt Chart
When timing is your major concern in project management, this is easily a catch. Overlapping components in projects tend to become a stretch and Gantt charts can be a great help. Moreover, they help you visualize all the needed steps and assign tasks based on priority more efficiently.
- Project Timeline
This template is basically a modified form of Gantt chart that emphasizes on the entire project schedule that’s broken down to several stages in the project life cycle. If this is your first project, this spreadsheet template can be your best friend. In fact, you can start right away learning how to manage and oversee your project timeline.
- Project Tracking
Effectively monitoring tasks is highly a significant activity for project managers. So this template helps you organize your projects (or tasks) into categories by date, deliverables, status, cost, and hours. Furthermore, setting priorities on tasks and projects can alleviate stress in project management.
- Event Marketing Timeline
The template grouped all necessary categories in a spreadsheet for planning an event and will definitely reduce the time you’ll need for a project launching. Additionally, you can use it to prepare for a business event or campaign.
7 Useful Formulas that You can Use
Templates in Sheets aren’t enough to get the job done. In fact, when you need a few customized results to enhance your reports and make them relevant to your decision-making, you can use these formulas:
1. =COUNTIF(Range, Criteria).
To count how many pending tasks in my waterfall list with the range from A2 to A89, here’s what the formula would look like: =COUNTIF(A2:A89,“PENDING”)
2. =TODAY().
It’s the fastest way to enter today’s date. You can also use it for date ranges in a spreadsheet. For example, if you want to build a report of data from the last 3 days, you can set the end date as =TODAY() while the start date will be =TODAY() – 3
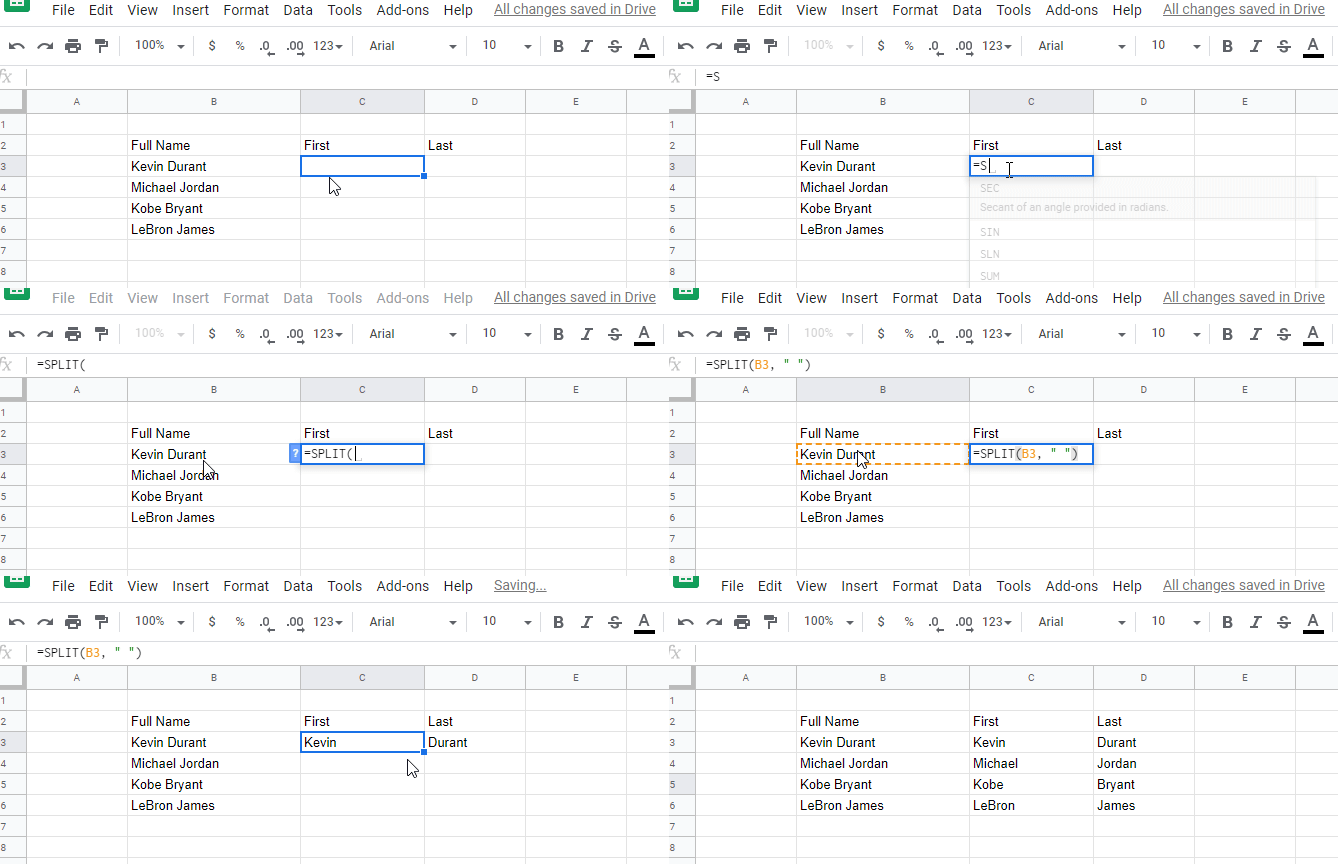
3. =SPLIT(Text, Delimiter).
This formula just allows you to split data from a single cell into multiple ones. Specifically, the delimiter is the character that splits the data into two cells.
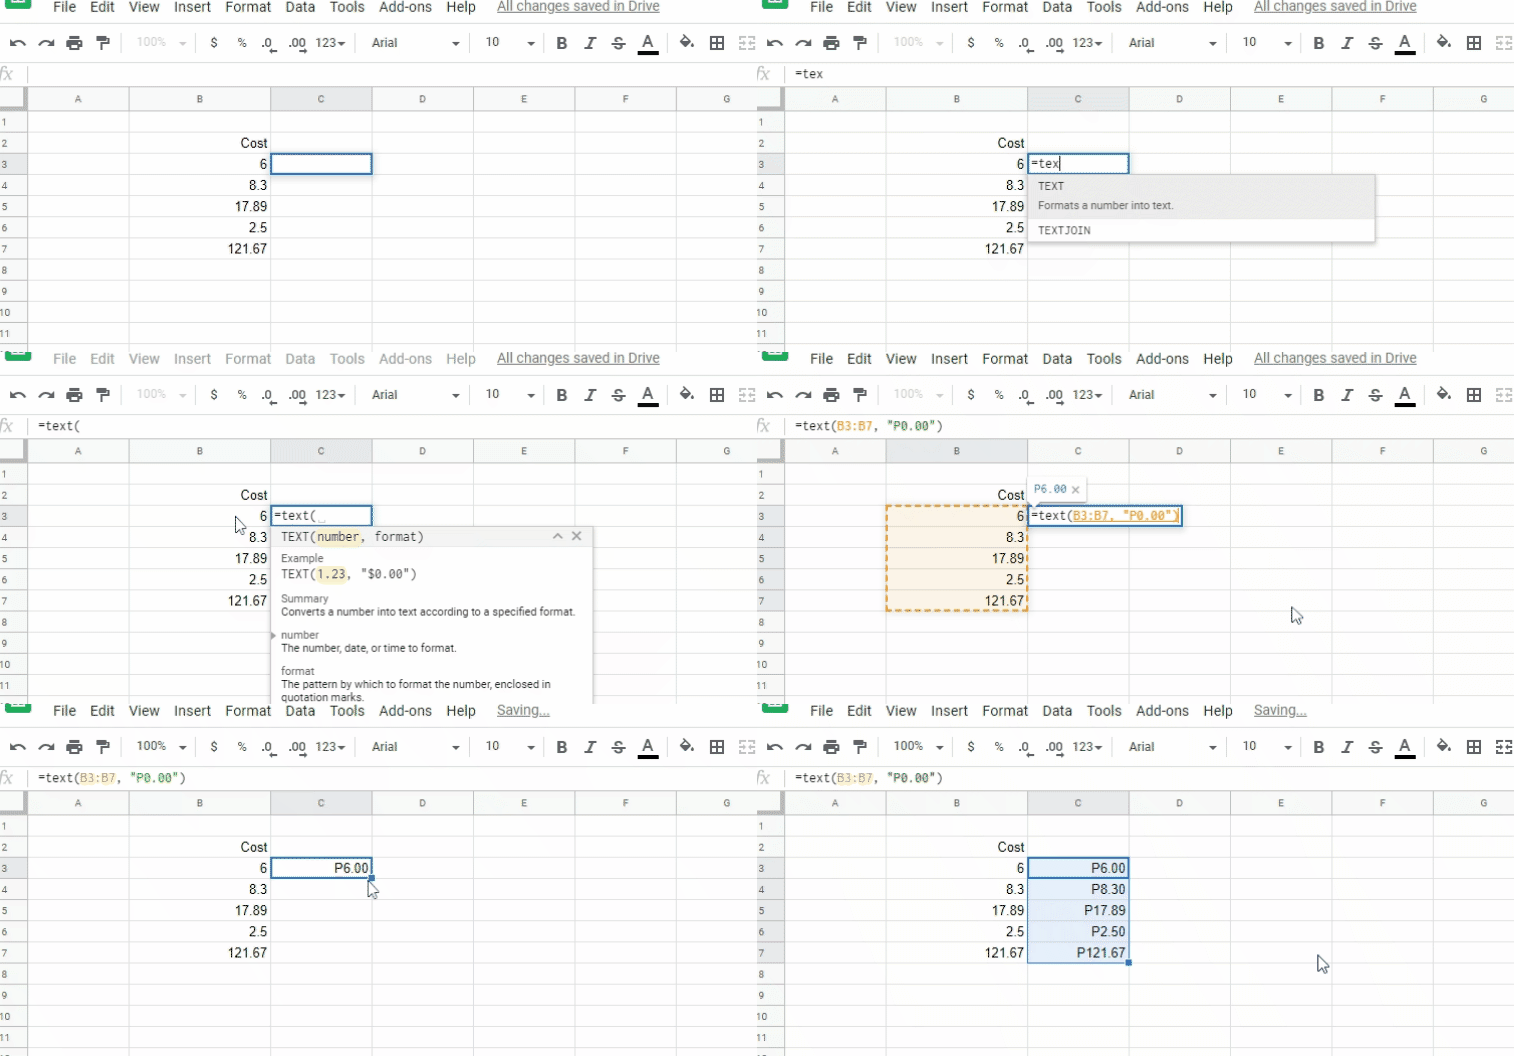
 4. =TEXT(Number, Format).
Using this formula, you can take any value and change its format. We can use it to change a number into currency or to have it take more decimal places. Furthermore, you can also change a date string into a different format.
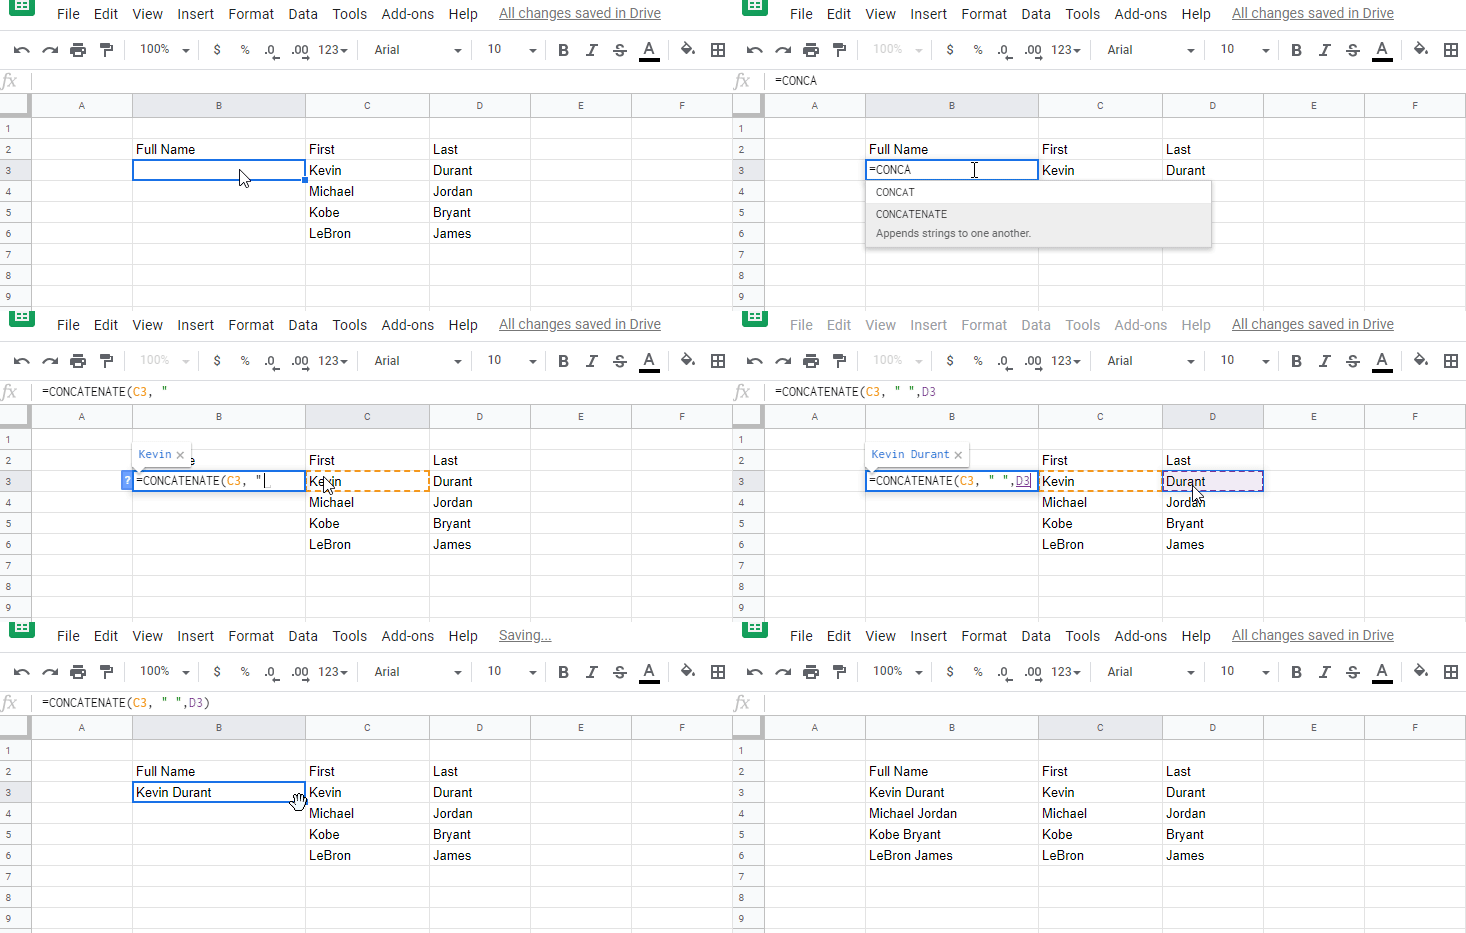
5. =CONCATENATE (string1, string2, string3).
The CONCATENATE function helps you combine data from two or more cells in a spreadsheet. To add a space in between the data, use “ “.
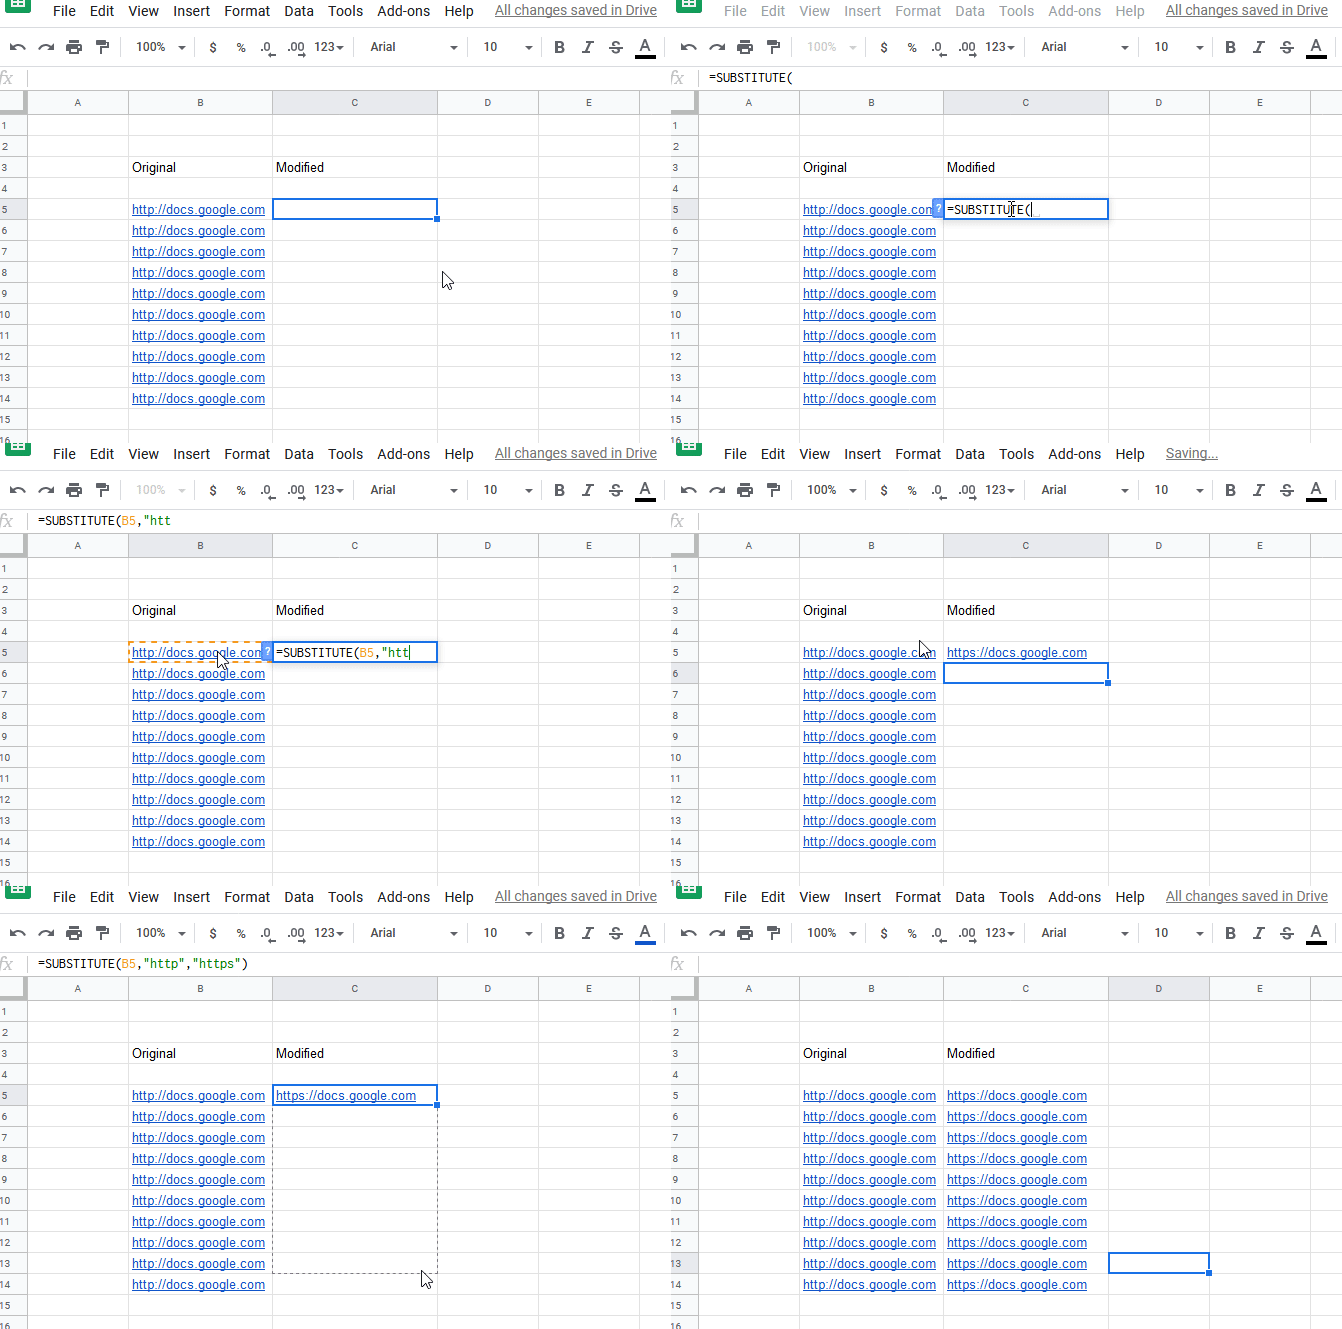
 6. =SUBSTITUTE(text_to_search, search_for, replace_with, [occurrence_number]).
Sometimes, you just need to replace an existing text with a new one in a string. What’s worse perhaps is that there’s just plenty of cells to replace. For example, check out the illustration below where we change http to https.
7. =VLOOKUP(search_key, range, index, [is_sorted]).
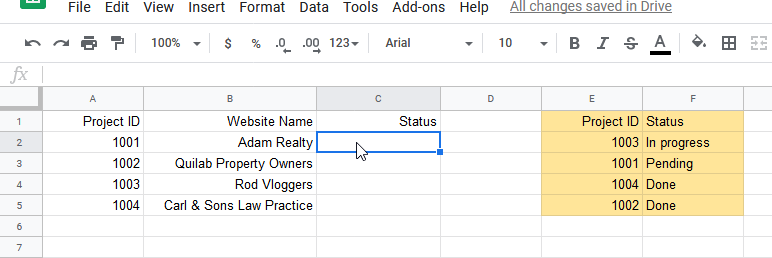
This is a tricky formula that needs a bit of illustration to be understood quickly. For instance, we have sample data below. The E-F columns will be our lookup table in our spreadsheet.
To accomplish this task, let’s break down our formula to that works with this scenario:
- Search_key – Project ID (A2), the value we will search for in the first column of the Lookup table.
- Range – the Lookup range ($E$2:$F$5). Note that we lock the range using absolute cell references so we can drag the formula without errors.
- Index – 2 since we want to return a match from the 2nd column in Range.
- Is_sorted – Set this to FALSE so that an exact match will be returned and NOT the nearest match.
Putting all of these together, we have this formula: =VLOOKUP(A2,$E$2:$F$5,2, false)
Particularly, remember these:
- VLOOKUP always searches in the first leftmost column of the range.
- VLOOKUP is case-insensitive.
Wrapping up with a recommendation
In closing, keep in mind that our projects’ success depends on our efficiency as project managers. Tools like Sheets and Google Docs are meant to advance our capabilities and make us effective to perform our tasks. And what’s great? They’re available to us for free.



Comment 0