

New Google PageSpeed Insights Features
Because of Google’s Ranking Factors, websites at the top of their game can gain plenty of organic traffic. However, even one problem can be enough to drag down their search engine results rankings. One particularly unhealthy Website Error is Slow Load Speed. So, website owners must learn how to use new Google PageSpeed Insights Features to their advantage.
Google makes a point of ensuring that its products serve users well. Part of this is its Chrome browser, which enjoys a 67.19% browser market share due to its helpfulness to Google users.
The tool assists website developers with data interpretation. Additionally, the tool gives information about how to act on the reported data.
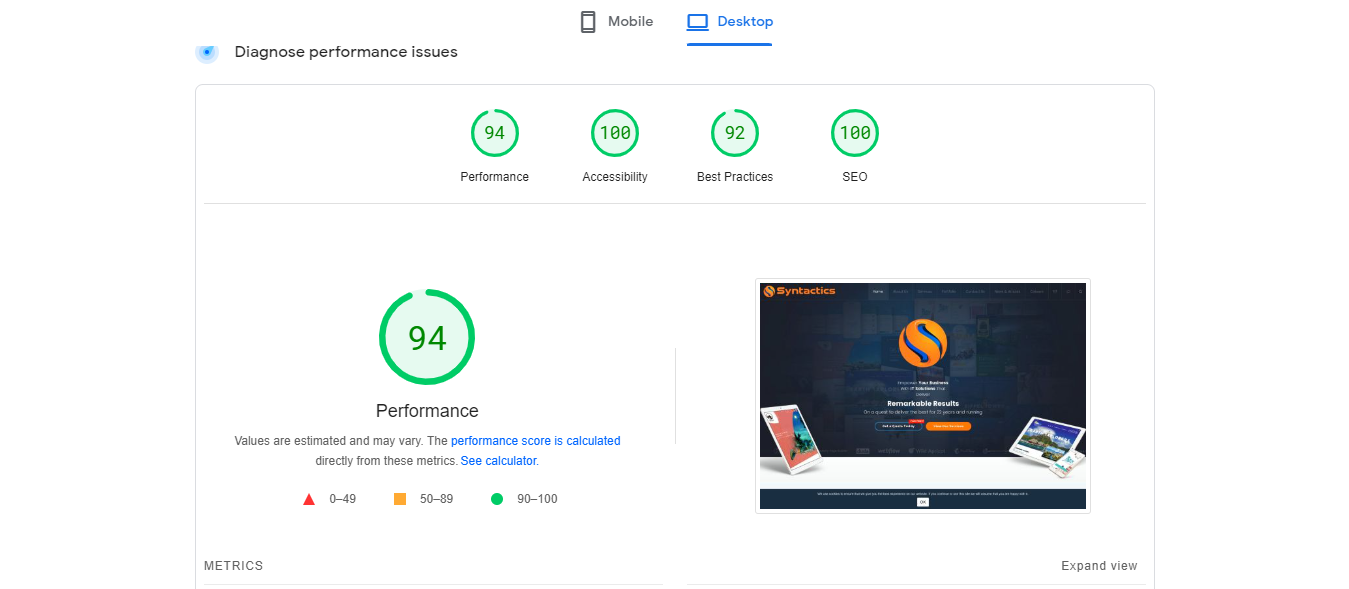
Recently, Google has made several changes to its Insights website reporting tool. If you’ve been using it for a while, you’ll realize it used to display only Performance in the performance metrics report. Nowadays, you can see metrics such as Accessibility, Best Practices, and SEO alongside Performance.
Look at Your Site’s Inner Workings with PageSpeed Insights
The Insights tool’s primary goal is to make data insights available and understandable to its users. That way, they can act on the reports, using them to create more improved websites. Thus, the Insights tool is vital for website owners who want to rank high on search results pages — Google’s especially.
The Insights tool analyzes webpage content performance on mobile and desktop, then suggests ways to speed up its load time. It’s become an informative platform that provides comprehensive information from Lighthouse diagnostics and the Chrome UX Report. Additionally, website owners can examine Lab and Field Data.
Lab Data refers to information collected from controlled environments. It can help improve performance issues. But since you’ve collected it from a controlled environment, you might not encounter all the potential problems you can face.
On the other hand, Field Data collects real-world usage data but has limited metrics.
So, Insights is one of the most Website Speed Test Tools used for checking site speed. Although its previous version had issues, one can’t deny its exceptional helpfulness. So, here are the advantages of using the Insights tool:
The Benefits of Using Google PageSpeed Insights
Get Experience Data About Real Users
The Chrome User Experience Report or CrUX dataset powers Insights. In particular, the CrUX dataset reports on real-user experience data. So, it gives information on the following experiences over a 28-day data collection period:
- First Contentful Paint or FCP
- First Input Delay or FID
- Largest Contentful Paint or LCP
- Cumulative Layout Shift or CLS
- Interaction to Next Paint or INP
- Time to First Byte or TTFB
Defines and Classifies User Experience Quality
The tool assesses the quality of user experiences, classifying them into three results — Good, Needs Improvement, or Poor.
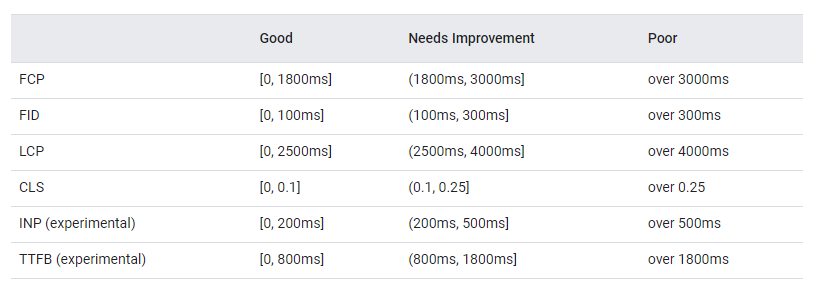
Source: Google.
Presents a Distribution of Metrics
With the tool’s distribution of metrics, website developers understand the experiences for the page. So, much like the previous advantage, they have three categories: Good, Needs Improvement, and Poor. In addition, they’re represented by green, amber, and red, respectively. Above these bars, users can check what’s frustrating the website visitors or users.
Informs You About Core Web Vitals
Core Web Vitals are performance indicators for web experiences, encompassing the FID, LCP, and CLS metrics mentioned above. Again, these can be aggregated at either page or origin level. Also, if the aggregation has sufficient data for all three experiences and their 75th percentiles are Good, it passes the assessment.
Fortunately, if there’s insufficient FID data, you can still pass the assessment as long as your LCP and CLS metrics’ 75th percentiles are Good. But, if you have either inadequate LCP or CLS data, you can’t assess the aggregation.
Displays Differences Between Field Datasets
You get daily updates on the tool’s Field Data and monthly updates on the BigQuery dataset, which is limited to origin-level data. However, both sources collect data on 28-day periods.
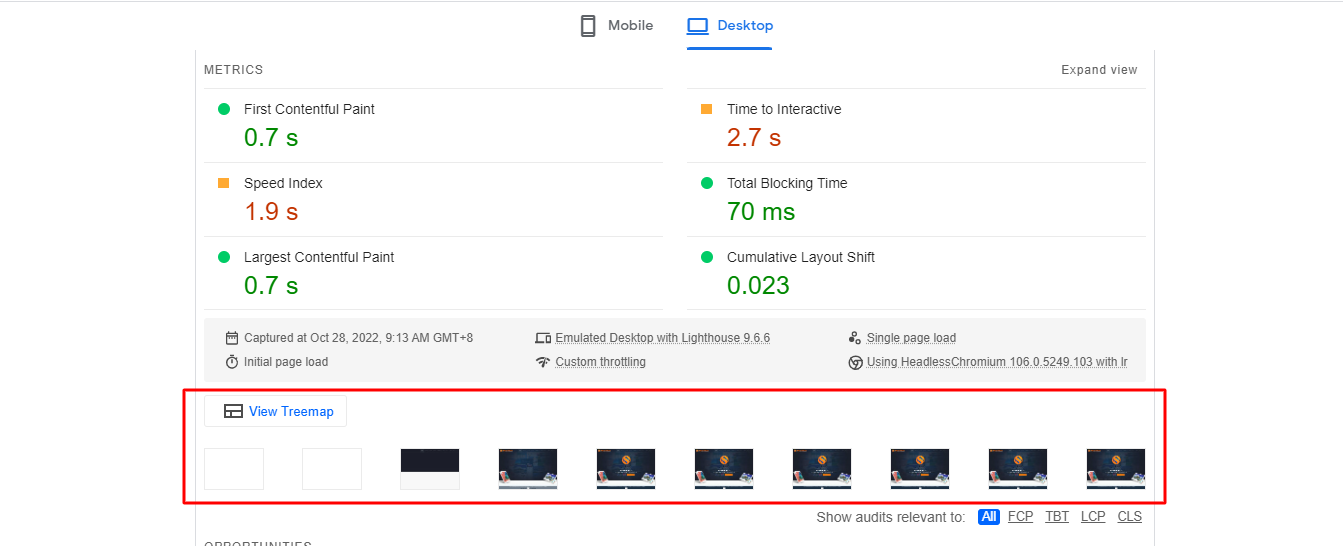
Analyzes Website Performance
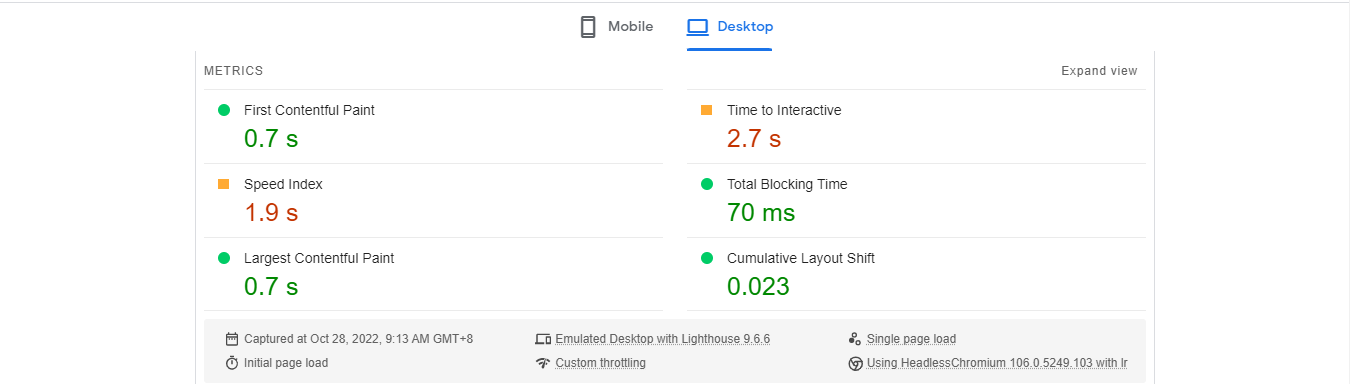
The tool uses Lighthouse to analyze sites and provides performance diagnostics on varied metrics such as:
- FCP
- LCP
- Speed Index
- CLS
- Time to Interactive
- Total Blocking Time
Lastly, the metrics are scored and labeled.
Lets You Check Performance Ratings
A web page’s performance score is calculated from its diagnostic information. You can see the performance score at the top of its associated section. Scores from 90 and up are Good, and a site that scores within the 50 to 90 range Needs Improvement. Lastly, websites that achieve scores under 50 are Poor.
Provides Audits
Audits are separated into three sections: Opportunities, Diagnostics, and Passed Audits.
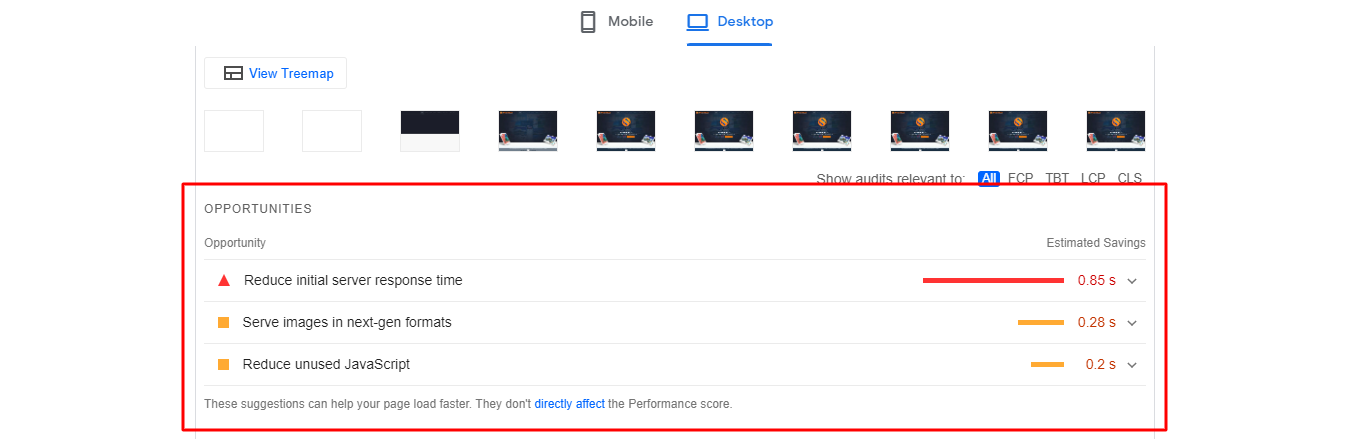
Opportunities will include suggestions for improving page performance. Also, you can get estimates on the page loading speed if you follow the recommendations.
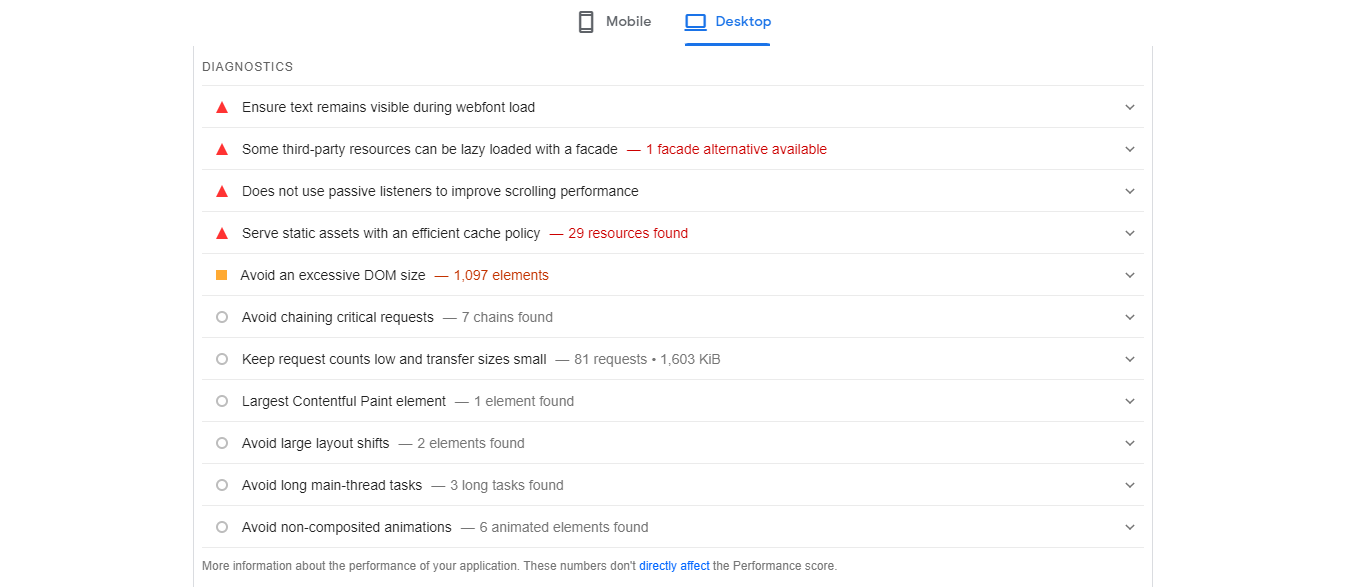
Diagnostics offers more information on how well a page follows Web Development best practices.
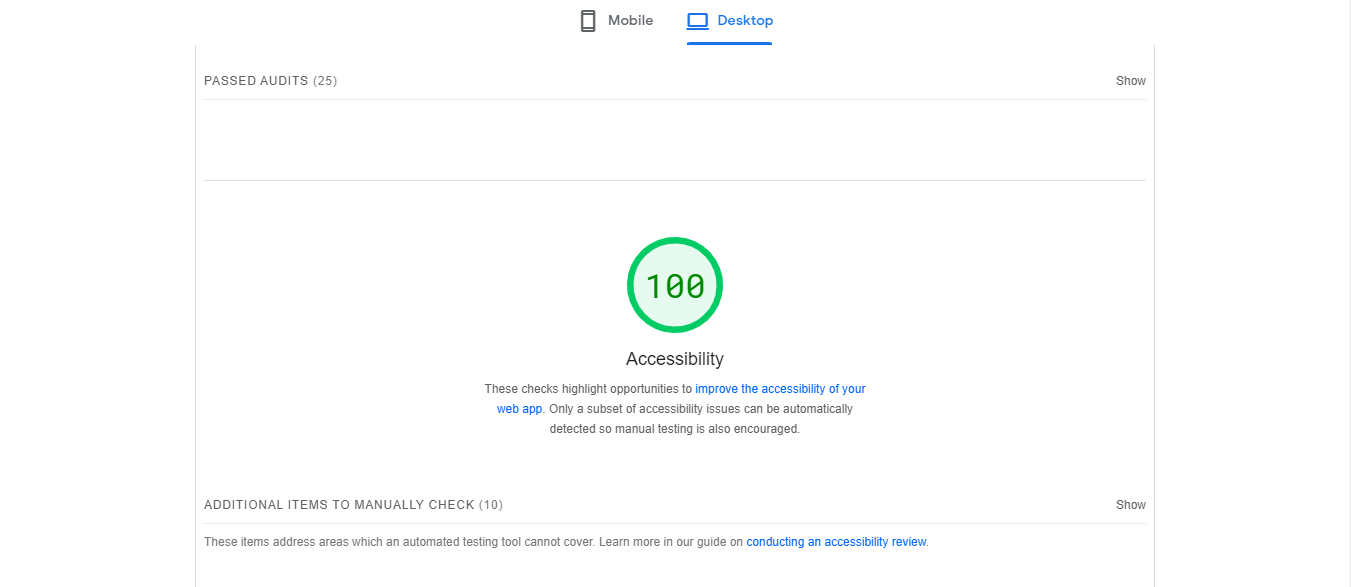
Passed Audits displays audits that the page passed.
A List of New Google PageSpeed Insights Features
The Insights tool is helpful to people who want to optimize their websites for speed. But, the tool’s reports allow people to make modifications for the benefit of the website and its visitors. Speeding up websites of all sorts — such as WordPress and WooCommerce — is key for any website owner.
Previously, there was no shortage of guides for interpreting the report due to its confusing design. Also, the format would be even less clear to first-time users. Lastly, they may not fully understand the meaning of the data in the report and be unable to apply the findings to their websites.
However, with these new features, the tool becomes more intuitive. Overall, User Experience improves, making it easier than ever to follow the tool’s suggested actions. So, here’s what website owners can expect from current reports:
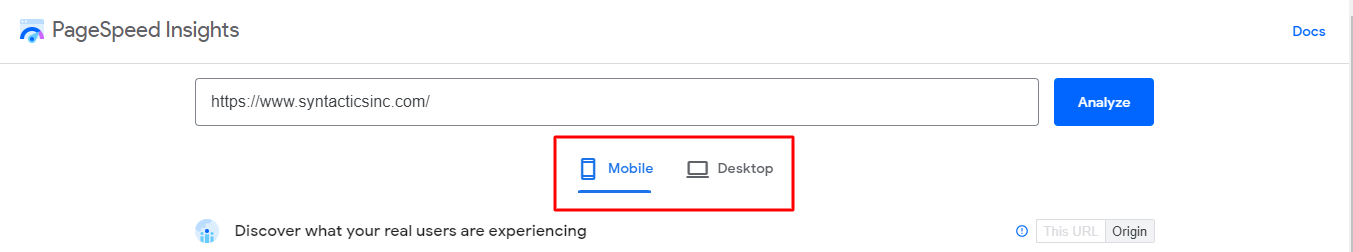
New Tool URL
Before the Insights tool was revamped, it was located at a more convoluted URL: https://developers.google.com/speed/pagespeed/insights/. However, you can currently find it at https://pagespeed.web.dev/.
Clearly Separated Lab and Field Data
For Insights users who desire organization, you’re in luck! The labels for Field Data and Lab Data will indicate how either or both data types can assist you. So, the tool now distinctly labels the sections for:
- Lab Data (which comes from synthetic environments); and
- Field Data (comes from users in the field).
Not only that, but the Field Data section is now at the top of the tool page. Also, the Performance Score, which is Lab-based, has been moved lower to the Lab Data section for clarity.
Thus, the tool’s UI is more intuitive, and you can differentiate between data types. Finally, you’re free to use the data most relevant to your needs.
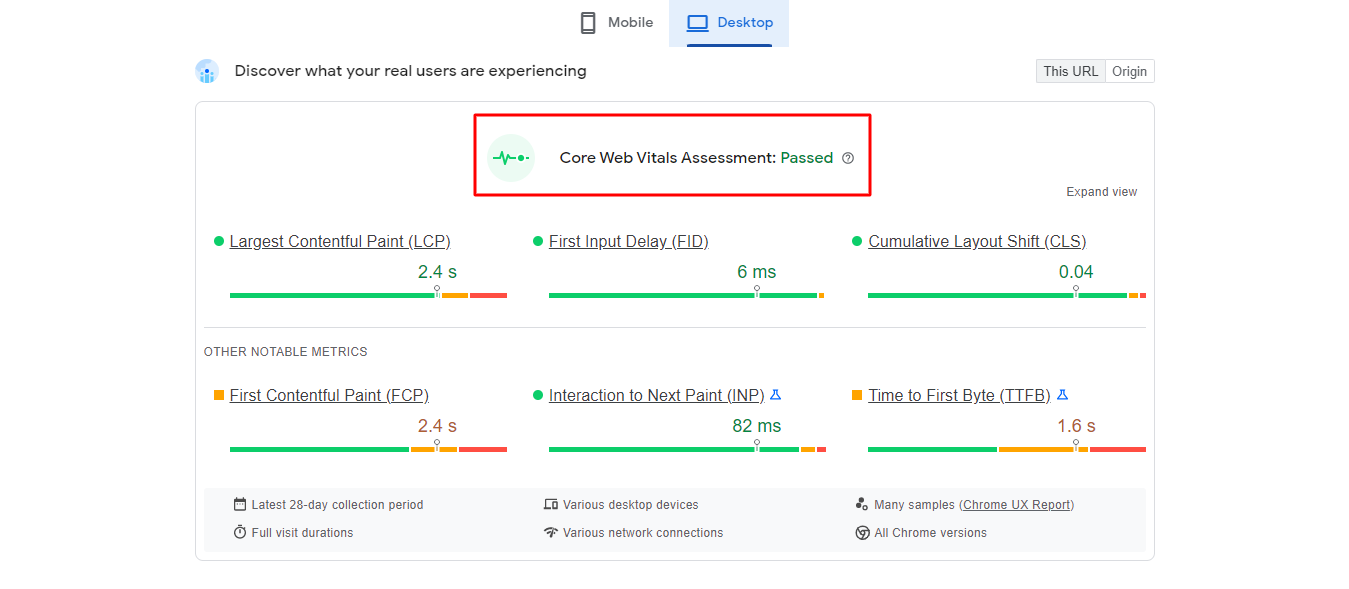
Core Web Vitals Assessment Results
An excellent Core Web Vitals assessment is critical for a top-notch Page Experience. Fortunately, the PageSpeed Insights tool has a Core Web Vitals assessment section. Previously, this section would only provide a single-word result — either ‘passed’ or ‘failed.’
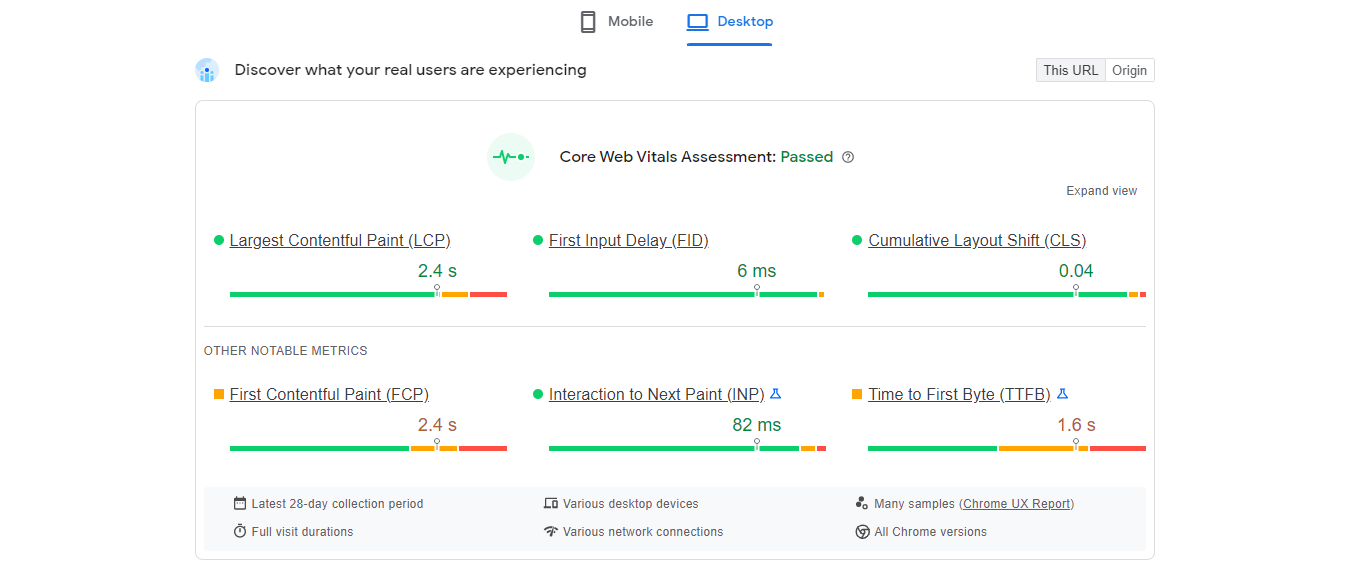
Now, users can see it as an independent section with more details and a unique icon. However, the Core Web Vitals assessment process is still the same. So, three-quarters of your page views are still subject to the Insights tool’s key metrics:
- Largest Contentful Paint (LCP);
- First Input Delay (FID);
- Cumulative Layout Shift (CLS);
- First Contentful Paint (FCP);
- Interaction to Next Paint (INP); and
- Time to First Byte (TTFB).
Mobile and Desktop Performance Labels
In addition to labeling Lab and Field Data, the Insights tool makes Desktop and Mobile Performance sections more distinct.
Currently, both links on the Insights report page are visible for anyone viewing their site’s data at the top of the page. Previously, the navigation menu did not have such links to indicate what platform the data was for.
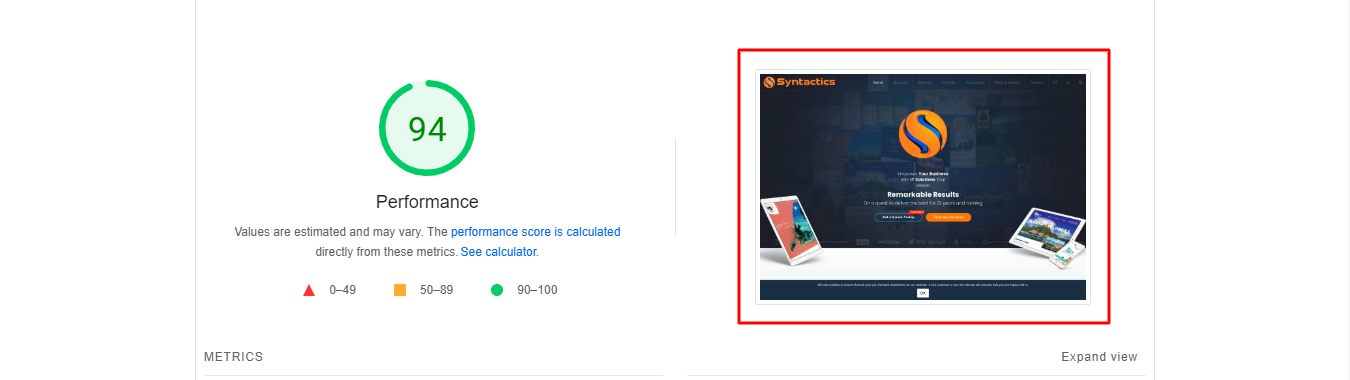
A Page Image
Before, users could see a screenshot of a loaded page next to the Field Data section. However, its thumbnails have been moved to the Lab Data section. In addition, the thumbnails will display the loading sequence.
‘Expand View’ Feature
This feature allows users to check more details for Core Web Vitals metrics. By expanding view, you can look at sampled data, particularly:
- Chrome versions;
- data collection period;
- devices;
- network connections;
- sample size; and
- visit durations.
Moved Origin Summary Report Section
The Origin Summary, which displays the aggregated CrUX score, is now moved to a different tab. Specifically, it appears in the ‘Origin’ tab in the Field Data section. So just click on a checkbox, and you’ll see the Origin Summary report segment.
Final Thoughts
Google PageSpeed Insights is a powerful tool for ensuring an excellent Page Experience for website visitors. In addition to performance-boosting suggestions, the tool provides data on desktop and mobile device page performance.
Google made changes to the tool in early November last year. So, Google’s new PageSpeed Insights is meant to be easier to use, with a more intuitive User Interface. Also, the tool now differentiates field and lab data. Lastly, it shows how Core Web Vitals are assessed and calculated.
If you want your website to load as quickly as possible, talk to a Web Developer from the Philippines. They’ll ensure your Core Web Vitals achieve high scores with the help of the Insights tool. They’re also sure to be able to maximize the tool’s excellent insights to create a more effective website.
About Adam Tan
Adam is a charming geek who loves his family's Siberian Husky, enjoys the occasional night out with friends and, most of all, lives and breathes new trends and updates about the web and its technicalities. If you want to stay updated with changes or new trends on the web or learn about the technicalities that are involved, he's your guy. He's capable of writing cheesy stuff as well, but he'd rather stick with the manly stuff.
- Find more about me on:

About Adam Tan
-
Find more about me on:


Comment 0