

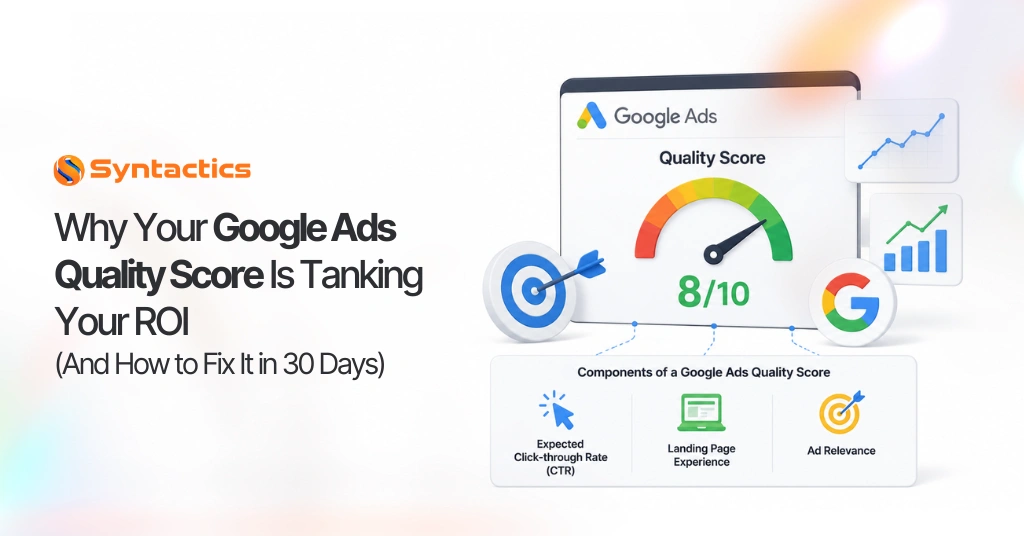
Why Your Google Ads Quality Score Is Tanking Your ROI (And How to Fix It in 30 Days)
Several business owners assume their return on investment on ads relies on their budget size or bidding strategy. While those factors matter, one overlooked metric that can also influence advertising costs and profitability is your Google Ads Quality Score. Although it’s not the sole factor in poor campaigns, completely ignoring it can lead to ads that barely deliver returns.
According to Lunio, you can save up to 50% of cost per click (CPC) if your quality score is 6 and above. Businesses that improve their ad relevance often see stronger campaign efficiency because the platform rewards higher quality experiences.
Here’s a simple breakdown of how Quality Score impacts your ad performance in CPC:
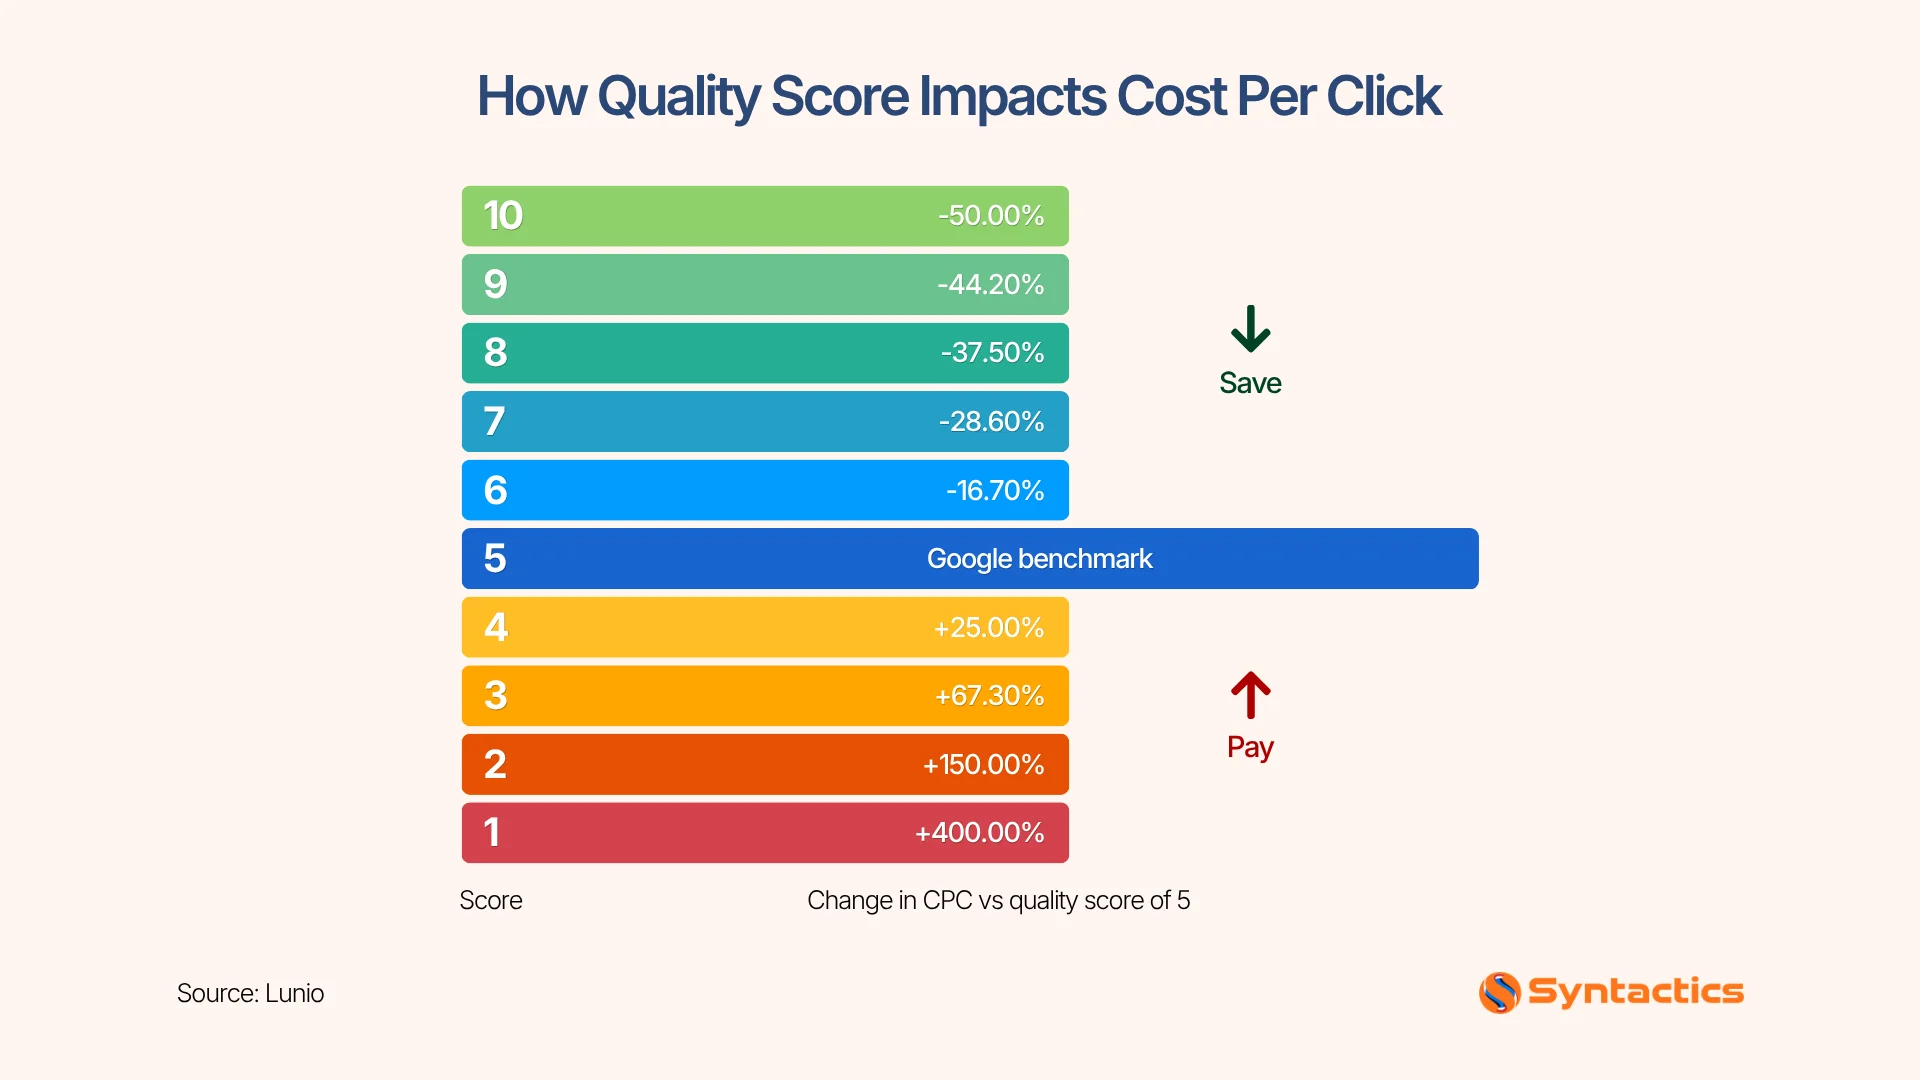
Source: Lunio
Key Takeaways
- Expected click-through rate and landing page experience account for 78% of your Google Ads Quality Score. (AdAlysis)
- Google Ads Quality Score is based on three core elements, which are expected CTR, landing page experience, and ad relevance.
- You can identify weak areas by checking the Quality Score, Expected CTR, Ad Relevance, and Landing Page Experience columns in Google Ads.
- A structured 30-day optimization plan can improve elements in your ad campaign to raise your Quality Score.
- A higher Quality Score can lower your cost per click while improving your ad position, helping you generate better ROI from the same budget.
- Regular optimization and performance tracking keep your campaigns efficient and prevent wasted ad spend over time.
3 Components of a Google Ads Quality Score
A Google Ads Quality Score is an estimate of how relevant and useful your ads appear to users. Instead of relying on a single metric, the platform evaluates three primary components that determine the quality of your campaign.
Expected Click-through Rate (CTR)
The expected click-through rate predicts the likelihood of someone interacting with your ad when it appears. According to AdAlysis data, expected CTR and landing page experience each contribute 39% of the total Quality Score in an ad campaign. A strong CTR tells Google that users find your advertisement valuable.
TIP: To increase your expected CTR, refine ad copy by improving headlines, incorporating compelling calls to action, and matching search intent.
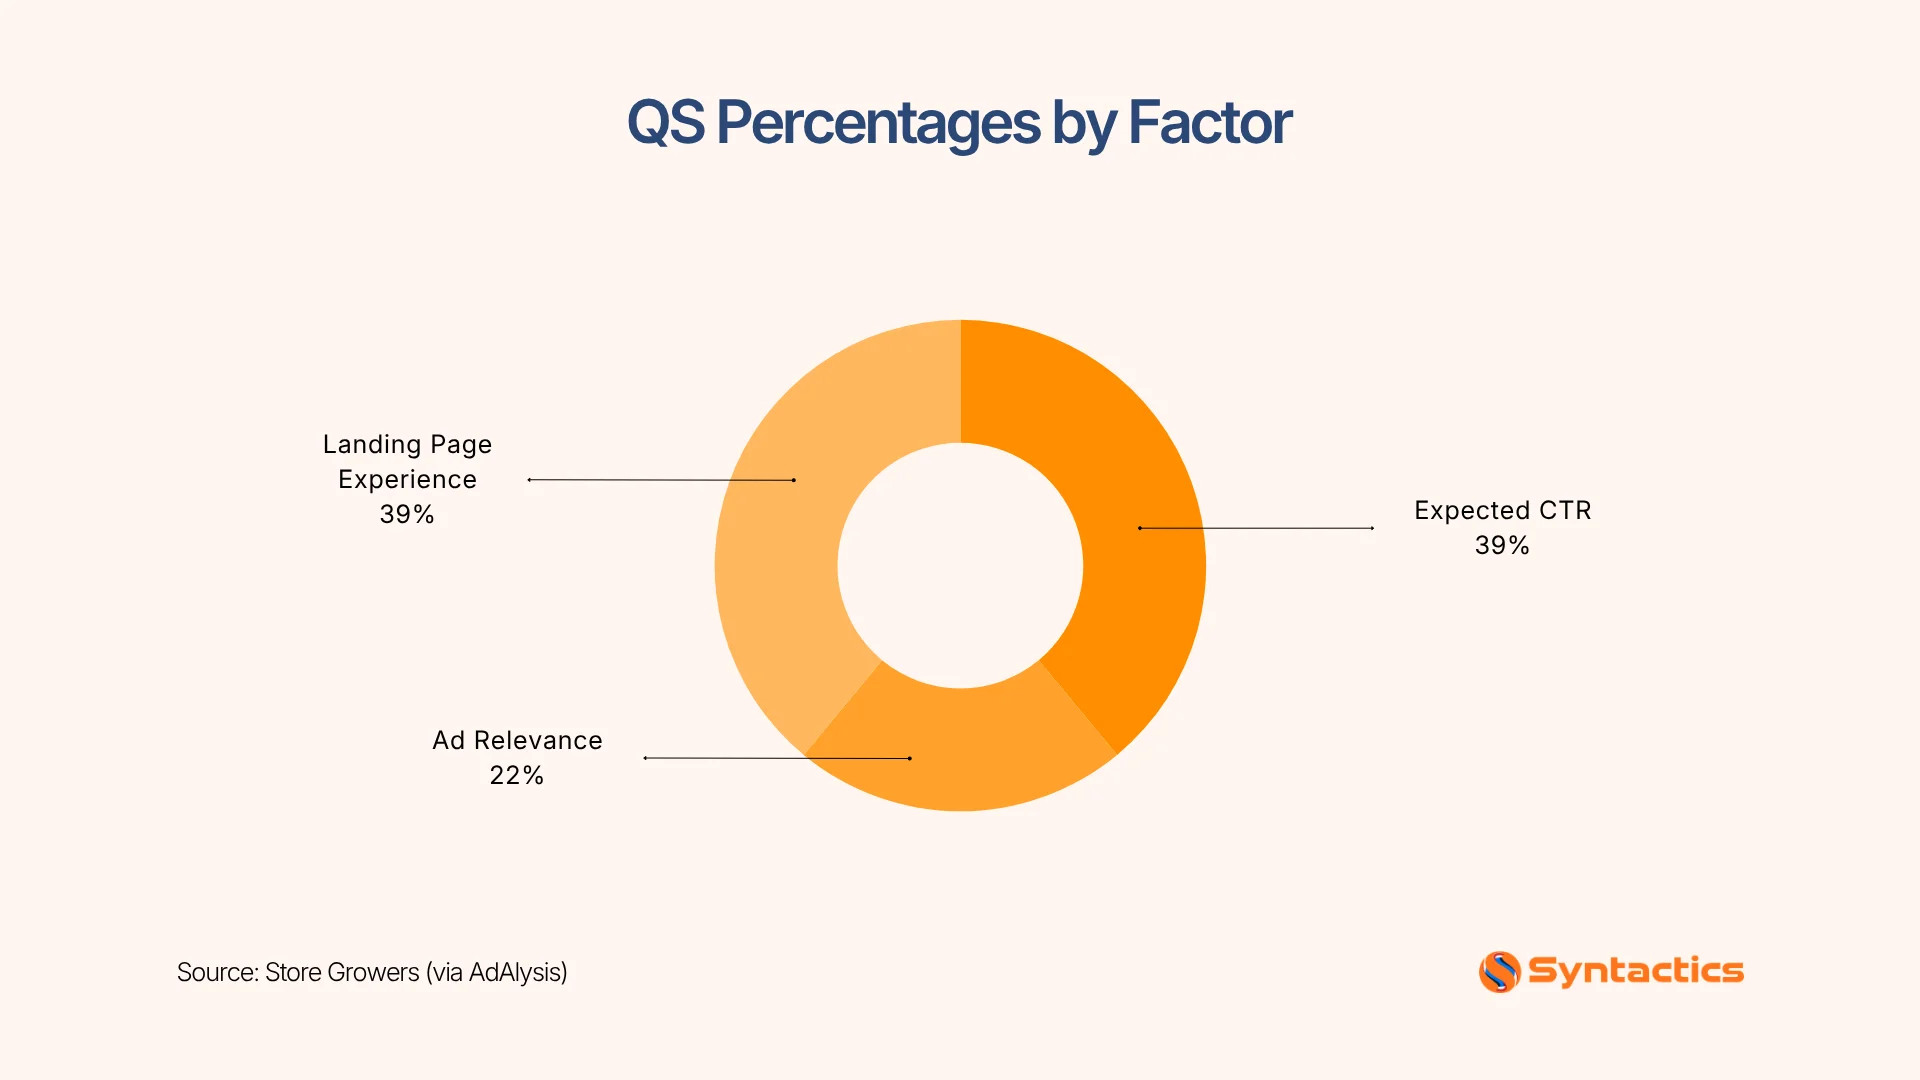
Source: Store Growers (via AdAlysis)
Landing Page Experience
Another factor that Google evaluates for your Quality Score is the landing page experience after someone clicks on your ad. To achieve an efficient landing page score, a PPC management service starts by improving your page structure during optimization. They also review its conversion tracking to monitor campaign health.
For more tips on improving your landing page, here’s our guide on the best practices:

Ad Relevance
Ad relevance measures how closely your advertisement matches a user’s intent on a search query. For example, someone searching “emergency plumbing services” should not see an ad focused on bathroom renovations. Grouping related keywords and writing custom ad copy for each group helps improve this rating.
Ad experts typically build tightly themed ad groups instead of placing dozens of unrelated keywords into one campaign. This approach improves relevance while reducing wasted ad spend. It also helps uncover poor keyword intent faster, preventing you from attracting unqualified clicks.
How to Check Your Quality Score
Once you know the components, the next step is to see where your account is weak. Here’s how you can find your Quality Score inside Google Ads:
Step 1: Open your Google Ads account, then click the Campaigns icon in the left navigation menu. In here, select Keywords to access your keyword performance table.
Step 2: In the upper right corner of the keyword table, click the Columns icon to customize the metrics displayed in your report. The icon should look like this:
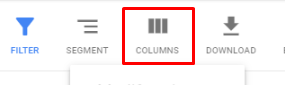
Step 3: Under Modify columns for keywords, click the drop-down arrow next to All columns, then expand the Quality Score section to view all available metrics.
Step 4: Select the current Quality Score metrics you want to display, including the following:
- Quality Score
- Landing Page Experience
- Expected CTR
- Ad Relevance
Step 5: To review your previous performance, select the following metrics to compare changes during your chosen reporting period:
- Quality Score (hist.)
- Landing Page Experience (hist.)
- Expected CTR (hist.)
- Ad Relevance (hist.)
Step 6: To monitor daily changes, segment your keyword table by Day, then click Apply to save your selected columns and display the Quality Score data.
30-Day Plan to Fix Your Quality Score
After checking the score, create a 30-day plan to improve your Google Ads Quality Score. Most businesses make measurable progress within this timeline by following a structured procedure.
Week 1: Improve Ad Copy Relevance
Review every ad group and make sure each one focuses on a specific theme, keyword set, or user intent. Then, check if the ad copy matches the search terms or categories, and filter out unrelated terms. Other courses of action to improve ad relevance include:
- Rewriting headlines using target keywords.
- Matching descriptions to user intent.
- Adding stronger calls to action.
- Removing generic messaging.
Being more specific and clear in your ad copy also helps filter out low-quality leads that only click out of curiosity but never convert.
Week 2: Optimize Your Landing Pages
Deliver the landing page experience users expect by enhancing its mobile responsiveness, content clarity, and calls to action. According to Hostinger, a well-written headline can increase your conversions by 307%.
Any digital marketing company in the Philippines or around the world improves both paid campaigns and website performance for stronger ROI. They also align landing page messaging with ad copy so users see the same promise from click to conversion.
Week 3: Enhance Keyword Organization
Carefully review your keyword structure and separate these terms according to service, product category, user intent, and location. Avoid placing unrelated search terms in the same group. Most PPC management experts simplify their campaign’s complexity before adjusting their budget to improve Quality Score. It also makes it easier to spot poor keyword intent and remove traffic that looks active but does not produce sales.
Week 4: Monitor Performance and Make Refinements
Google Ads continuously learns from your campaign performance, making regular adjustments a cumulative effort. To monitor which aspects of your ads need refinement, track these metrics:
- Quality Score movement
- Click-through rate (CTR)
- Conversion rate
- Cost per click (CPC)
- Impression share
Use this week to verify conversion tracking, compare lead quality, and review your bidding strategy against your data volume. Businesses typically perform these optimizations on a timely basis to keep Google Ads campaigns profitable.
For more information, check out our guide on evaluating ad performance:

What a Quality Score Improvement Actually Saves You
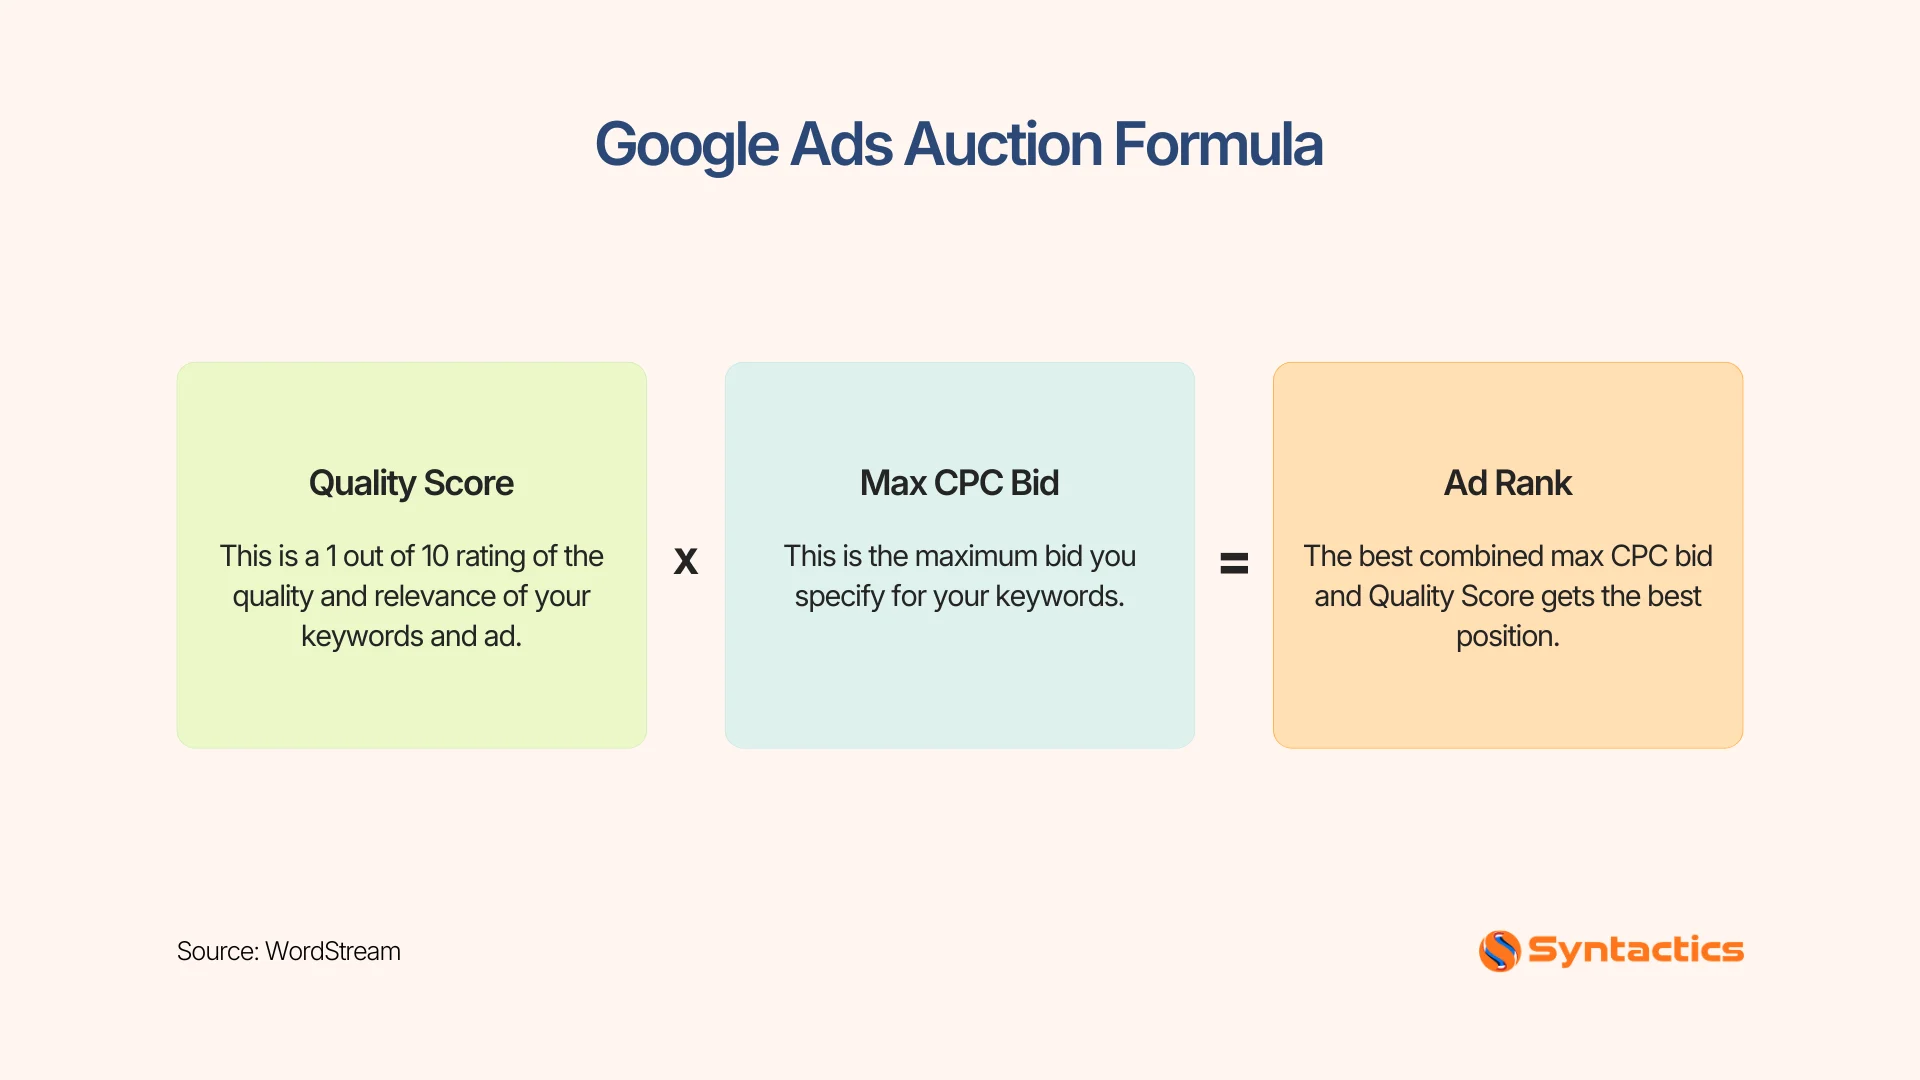
When your Quality Score improves, its budgetary impact can change your ad spend behavior. As previously mentioned, a higher rating generally saves you more in CPC while remaining in better ad positions.
For reference, here’s how your ad ranking is determined based on the auction formula:
Source: WordStream
Conclusion
Enhancing your Google Ads Quality Score involves strategic optimization that satisfies user expectations. Improvements in these campaigns can save you a lot in advertising costs while increasing conversions. At the same time, monitoring ad performance allows you to distinguish which ad campaigns are lagging behind.
If you’re generating clicks without proportional returns, working with experienced professionals can accelerate results. At Syntactics Inc., we provide strategic PPC campaign management services designed to improve campaign efficiency and maximize ROI. See how our team can boost your conversions today.

Frequently Asked Questions (FAQs)
What is a good quality score for Google Ads?
A Quality Score of 7 to 10 is generally considered good. Higher scores often lead to lower CPCs and better ad placements.
How long does it usually take to see Quality Score improvements?
Most advertisers see improvements within 2 to 4 weeks after making consistent optimizations. Results depend on campaign traffic and the changes implemented.
Does automated bidding remove the need to improve Quality Score?
No, automated bidding does not remove the need to improve your Quality Score as it still affects your CPC and ad rank.

About Jalou Batilong
Related News:





Why Outsource a Dedicated Project Manager?








Comment 0