
How to Analyze Mobile App Performance in Google Play
Mobile applications assist users in their daily lives, making them a critical platform for businesses. A professional digital marketing agency or company can analyze mobile app performance via Google Play Console!
Google Play is one of the main platforms for launching applications, aside from the Apple App Store and the Huawei AppGallery. Through it, mobile app developers can provide users with various tools and programs that address multiple needs!
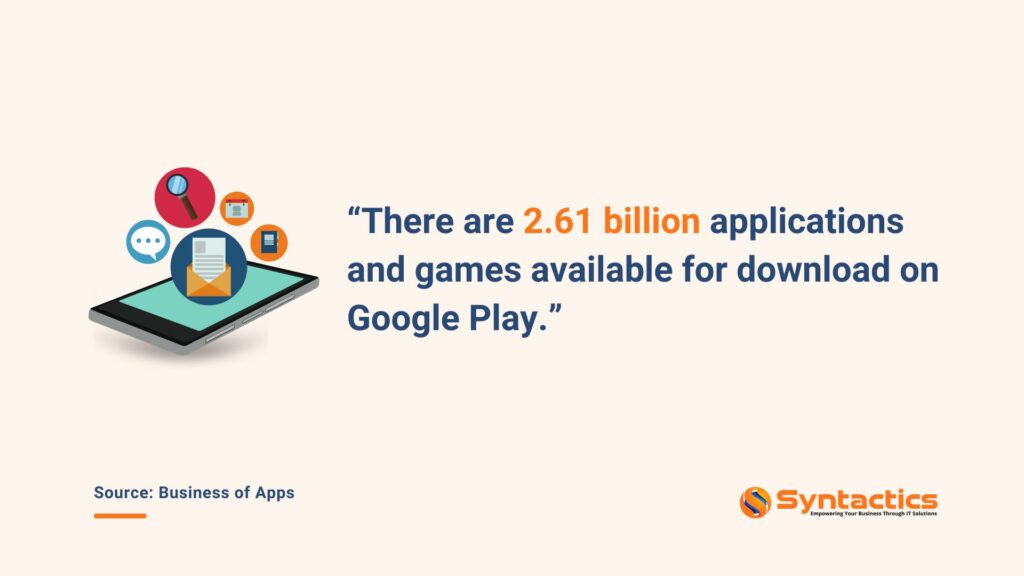
Source: Business of Apps.
After developers publish their applications, they can check Google Play Console to gain insights on how to improve it. Thus, the tool is essential for analyzing mobile app performance.
How to Set Up Google Play Console
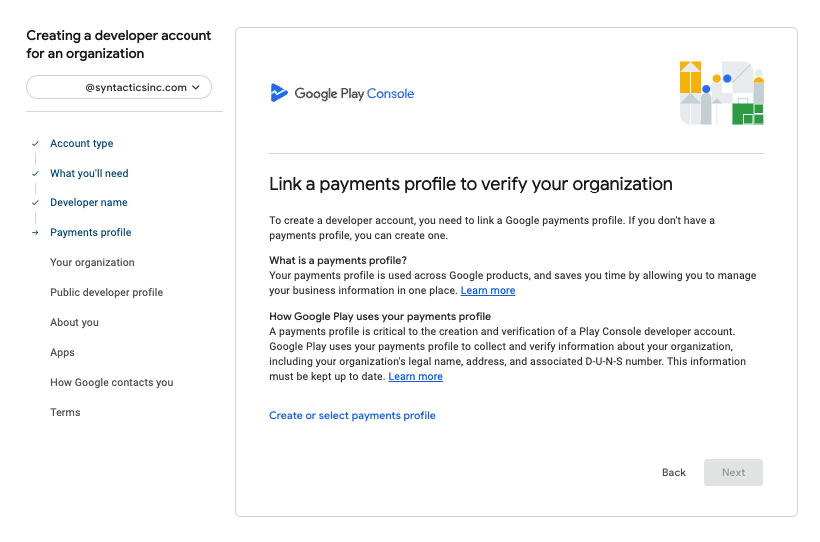
Before you can analyze your mobile app’s performance, you must first register for a Google Play Developer account. Here, you can use your Google Account to sign up.
During the sign-up process, Play Console will ask you to review and accept the Google Play Developer Distribution Agreement.
Learn How Business Application Development Services
Can Elevate Your Business’ Success!
There’s also a one-time registration fee of $25 that you’ll need to pay to continue creating your developer account.
After that, you’ll need to fill out your account details, including:
- Name;
- Physical address, and
- Contact information.
After registration, you can use the platform to publish and manage your apps.
The Google Play Console Interface
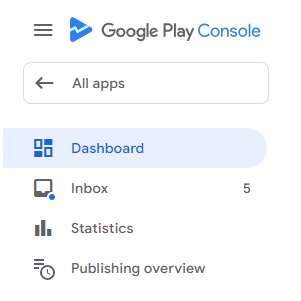
Once you’ve set up and verified your developer account, you can access the Play Console platform.
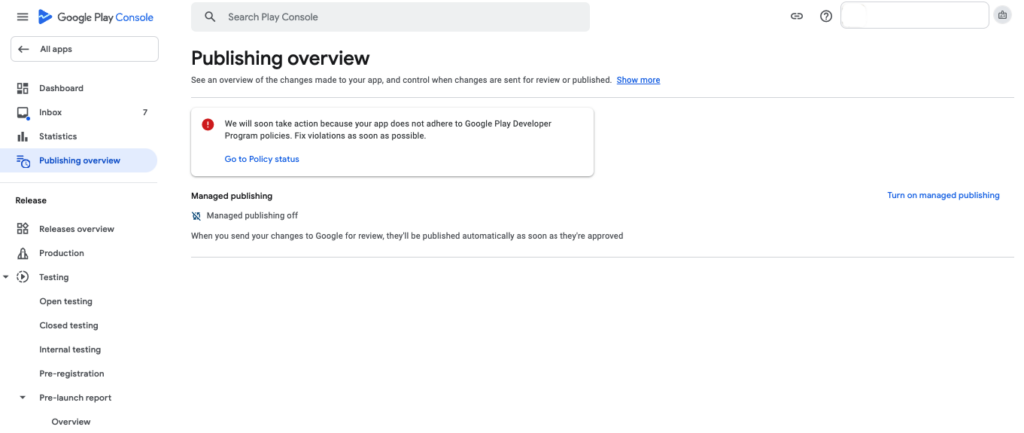
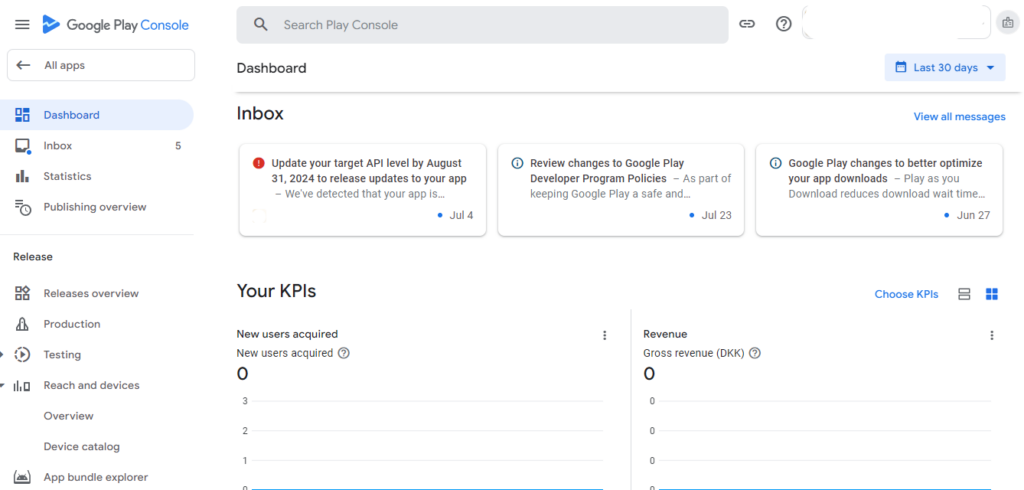
To get an overview of your application’s performance, you can select an app that you previously published on Google Play. Then, you’ll be able to see your app’s Dashboard, Inbox, Statistics, and Publishing Overview.
The dashboard will guide you through essential steps to publish the app on Google Play. In addition, you can view metrics, trends, notifications, and insights. These are vital to monitoring your mobile app performance after launch.


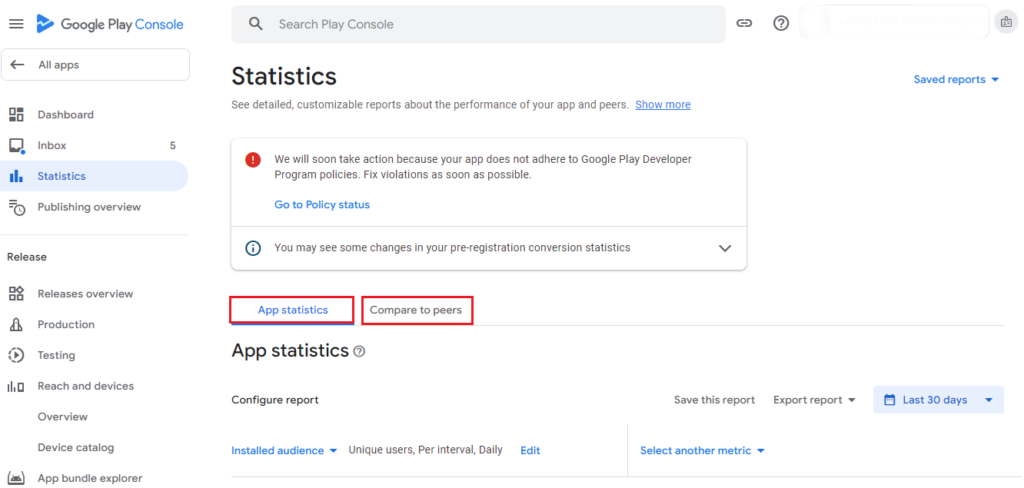
Under Statistics, you can view and customize detailed reports and analytics on your mobile app’s performance. The tabs “App statistics” and “Compare to peers” display vital metrics.
Finally, in the Publishing Overview, you can see the modifications you have made to your app. Moreover, you can control when you need to publish your app updates.
Google Play Console Metrics
Here are vital metrics that a digital marketing agency can use to examine your mobile app’s performance:
Installed Audience
UsersInstalled Audience
User acquisition
User Loss
|
DevicesInstall base
Installed modules
Device acquisition
Device Loss
Device updates
Device loss after update
Install events
Uninstall events
Device store listing impressionsDaily active devices |
EngagementDaily Active Users (DAU)Monthly Active Users (MAU)Monthly Returning Users |
RatingsAverage ratingGoogle Play Rating |
QualityCrashesANRsApp download sizeApp size on device (at install time) |
MonetizationDaily buyers
Daily buyers (PST8PDT)All buyersNew buyersMonthly buyers (PST8PDT)Purchases per day (PST8PDT)Purchases per month (PST8PDT)Gross revenue (DKK)Gross monthly revenue (USD, PST8PDT) |
Pre-RegistrationPre-registered usersConversions |
Store Listing PerformanceStore listing acquisitions
Store listing visitors
|
Our Reliable Mobile App Development Company
Can Create the Perfect Application for Your Business!
How to View App Statistics on Play Console
A professional digital marketing company can analyze mobile app performance through the Google Play Console Dashboard and the Statistics pages.
The Dashboard Page
Of course, the dashboard provides an overview of key metrics, insights, trends, and notifications. You can check on Pinned apps as well.
The General Interface
On the main dashboard of your chosen app, you can find various sections that display updated information, such as
- Inbox;
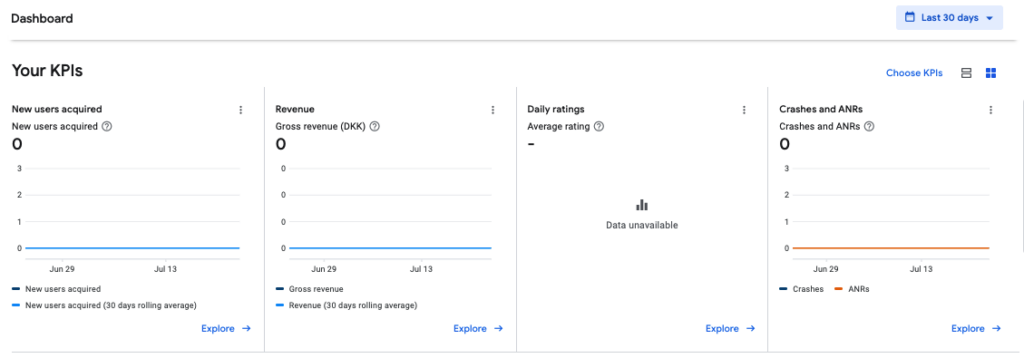
- Your KPIs;
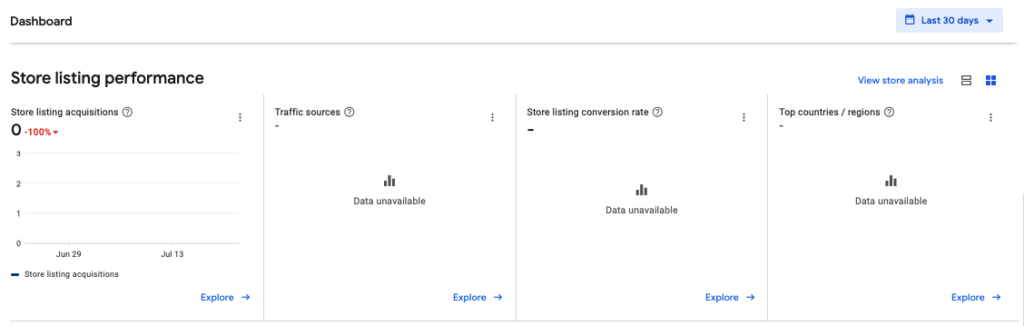
- Store listing performance;
- Android vitals;
- Ratings and reviews;
- Revenue;
- Subscriptions;
- Delivery, and
- Pre-launch report.
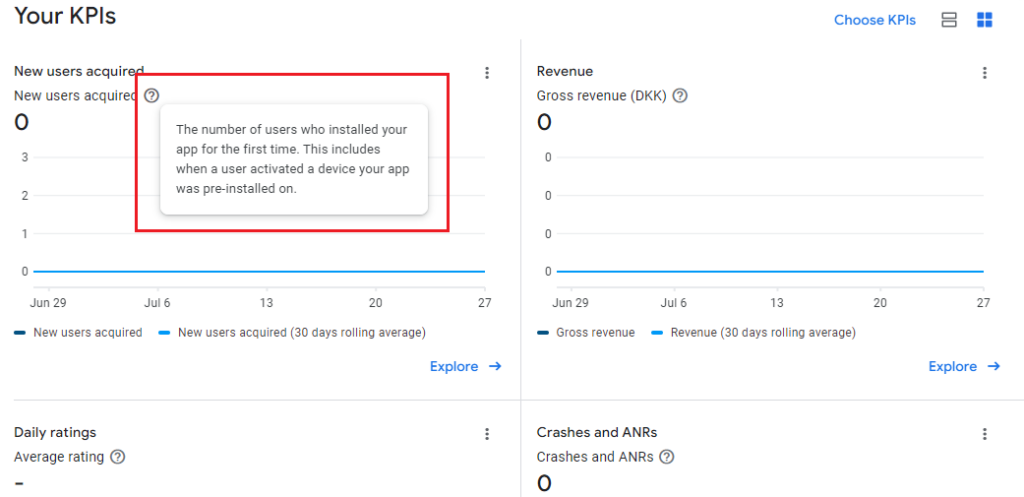
In addition, you can view more details on a specific metric by hovering on the question mark icon beside it.
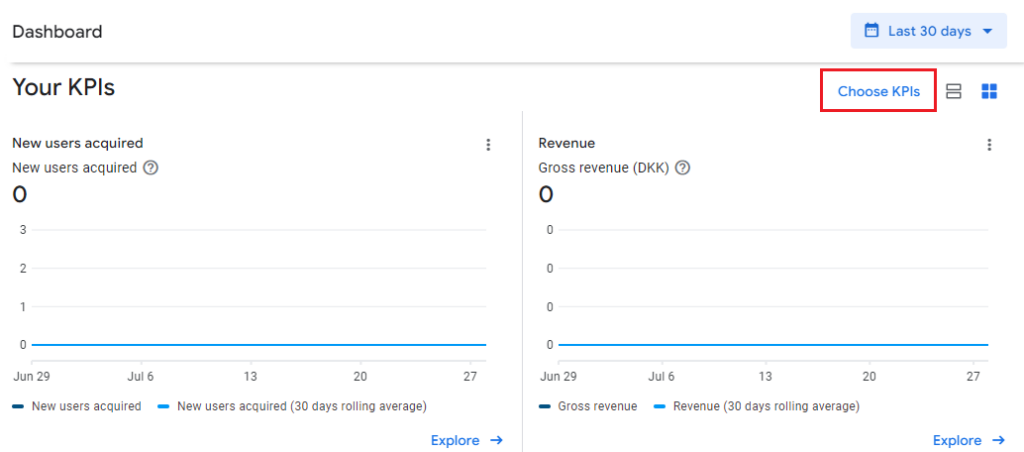
Key Performance Indicators
The Dashboard page also allows you to customize your mobile app’s Key Performance Indicators (KPIs). You can do this by scrolling down to the section labeled “Your KPIs” and clicking “Choose KPIs.”
A popup will appear where digital marketers can check the “All available metrics” section, which contains all your KPIs.
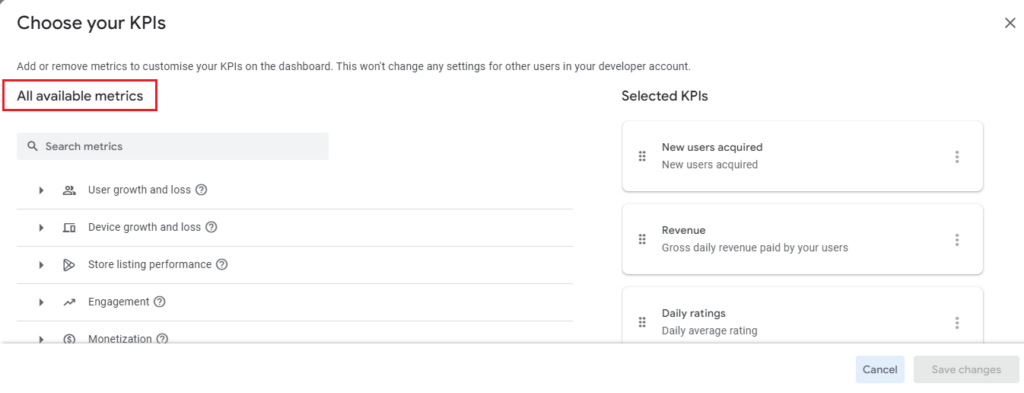
Here, you can create your own KPI or choose from the ones already provided, including:
- User growth and loss;
- Device growth and loss;
- Store listing performance;
- Engagement;
- Monetization;
- Quality, and
- Other dashboard cards.
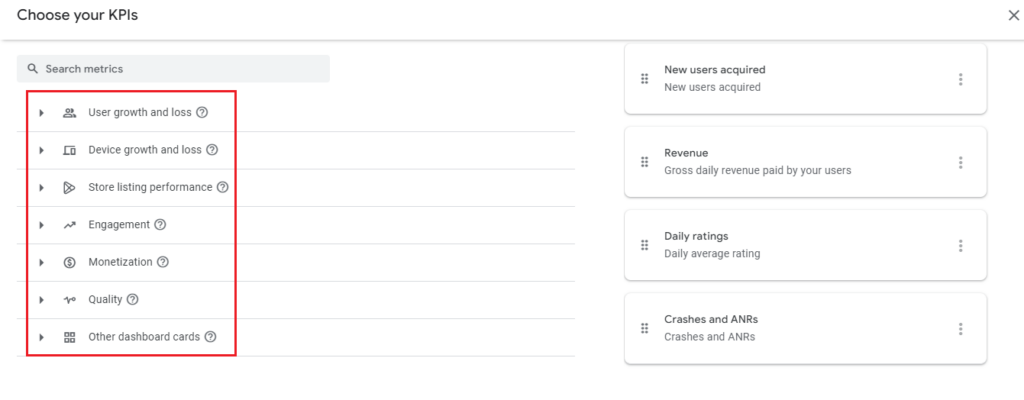
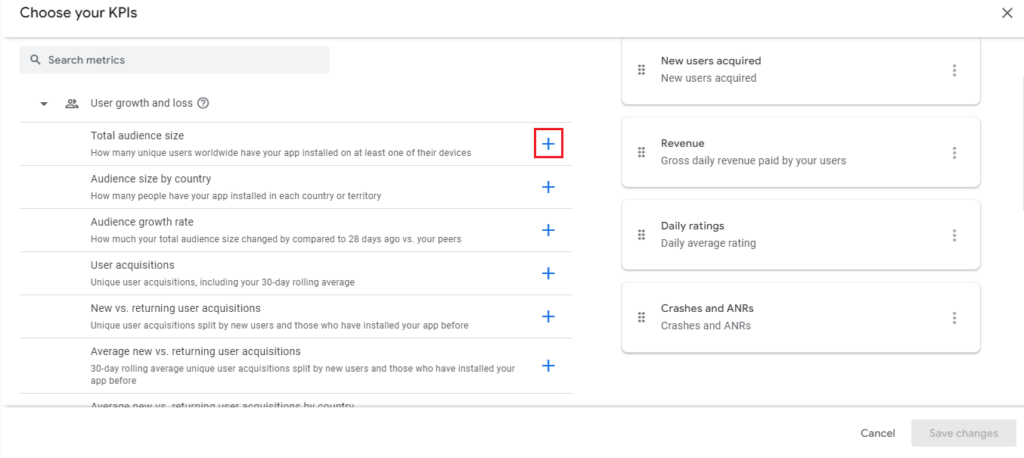
To pin a particular metric on your dashboard, you can click the “▶” button beside a desired category on the KPI list. Then, from the dropdown list of KPIs, click the “+” button.
After doing so, another popup will appear, and you can customize its KPI name and its dimensions.
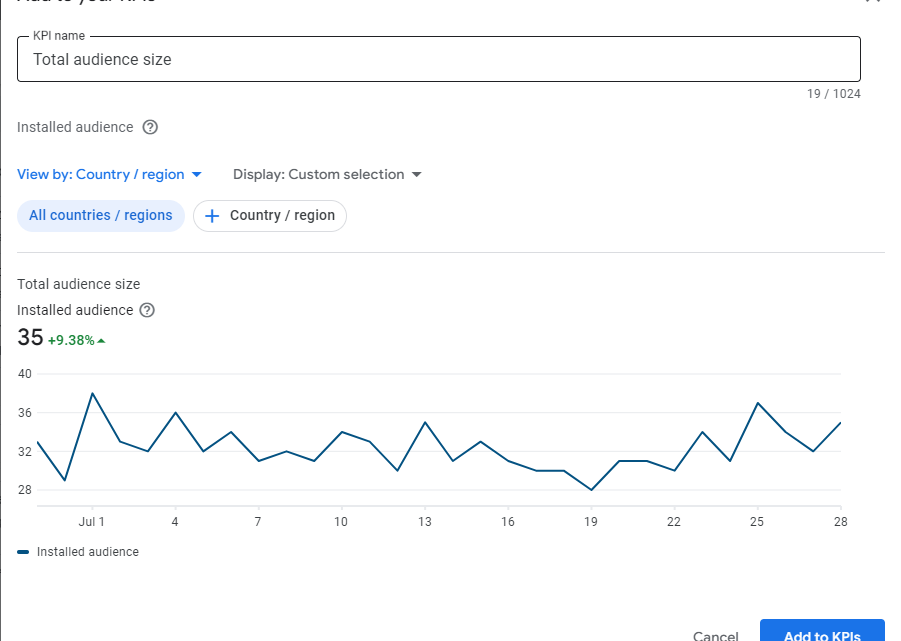
Once you’re satisfied with the customized KPI, you may click “Add to KPIs.”
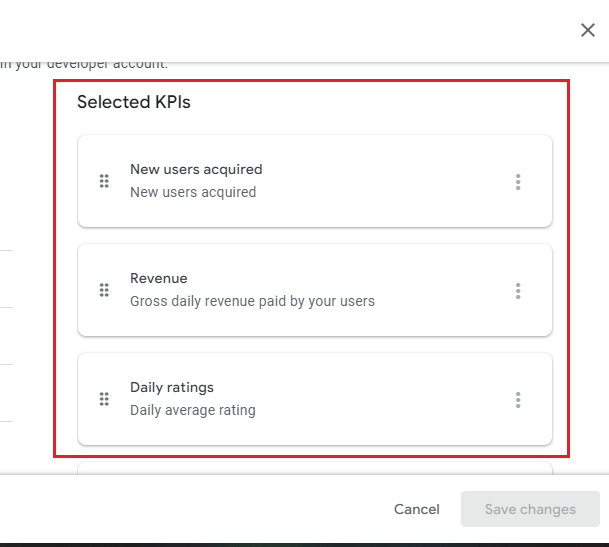
In the “Selected KPIs” section, you can arrange your KPIs by dragging and dropping.
The Statistics Page
The Google Play Console Statistics pages offer detailed reports on key metrics. Specifically, you can find them under the App Statistics and Compare to peers tabs.
A digital marketing agency can examine your app’s performance better through the Statistics page. It allows you to:
- Compare metrics;
- Compare the growth rate metrics between peer groups;
- Choose custom date ranges, and
- See data according to their dimensions.
Check Out Our Custom Application Development Services Here!
How to Set Up Your Google Play Console Report
A digital marketing company can set up reports on Google Play Console so you can gain a better understanding of your app’s progress. Here’s how:
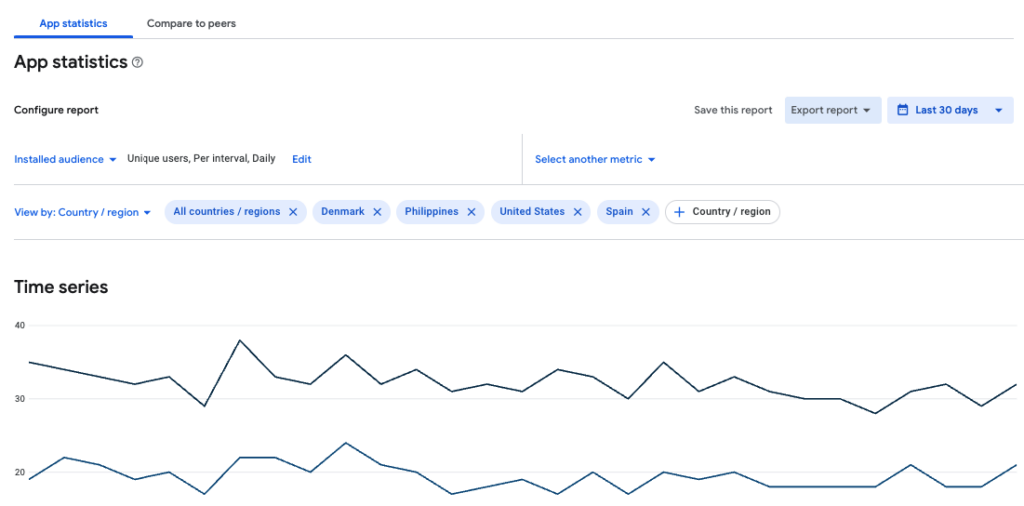
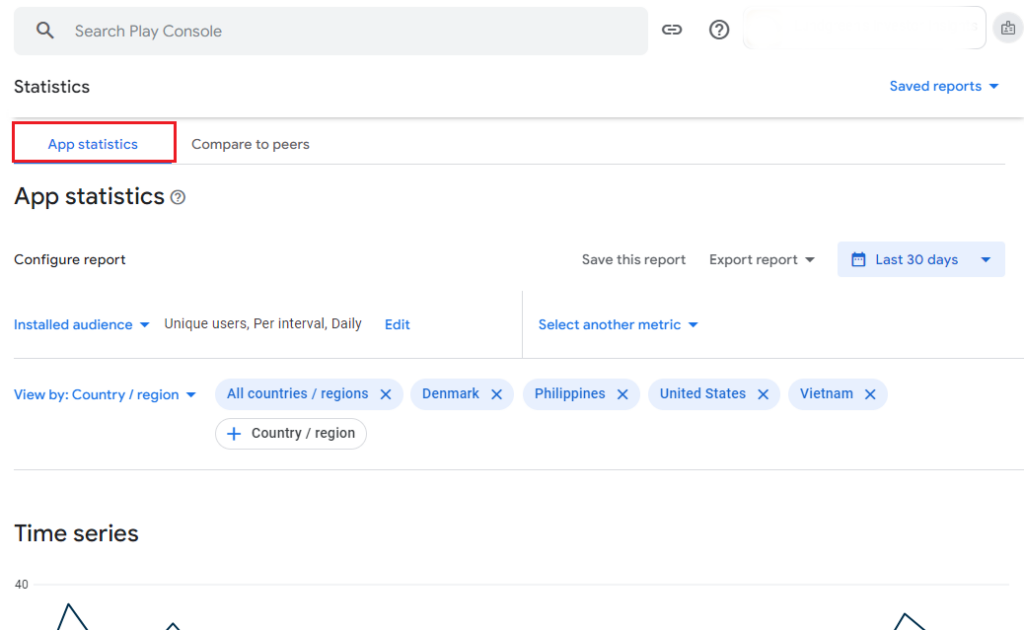
1. First, click on the app statistics tab.
The first step in evaluating mobile app performance is to click on the App Statistics tab on the Statistics page. Here, you can see your app’s absolute performance.
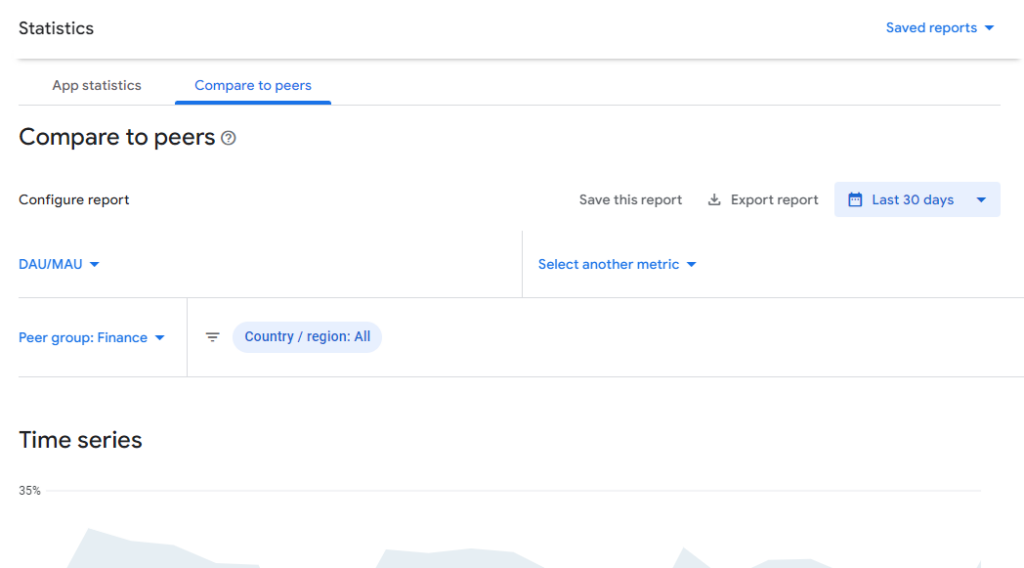
However, if you want to see your app’s normalized metrics and benchmarks, click on the Compare to Peers tab.
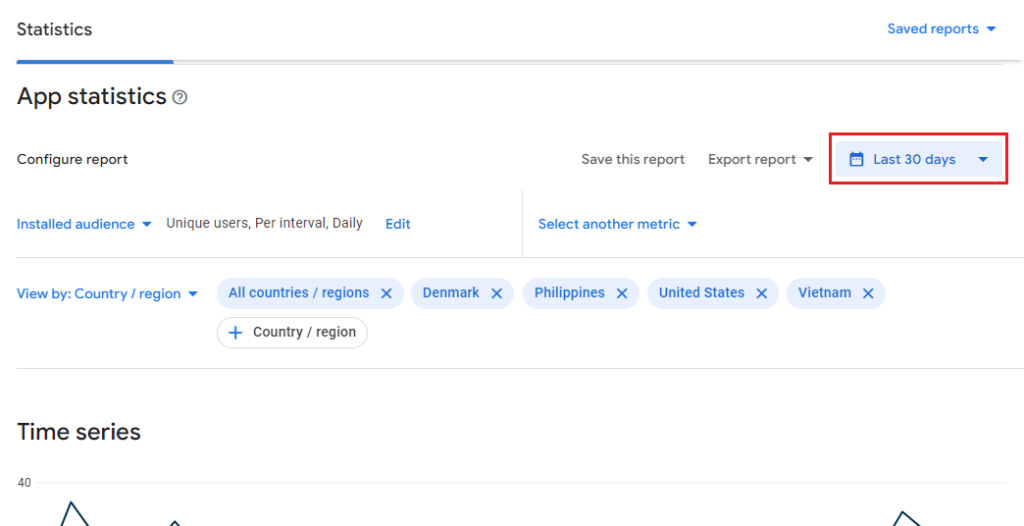
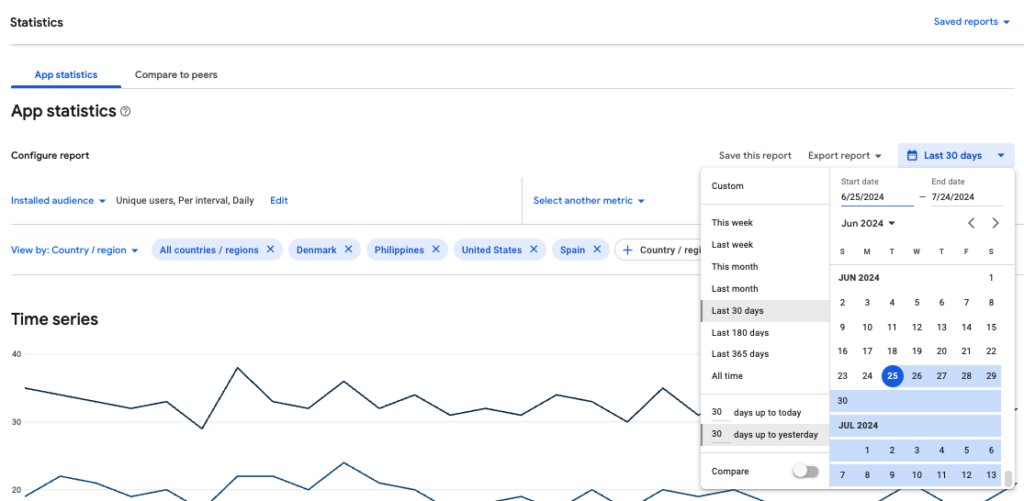
2. Choose the date range that you wish to view and analyze in the upper right corner.
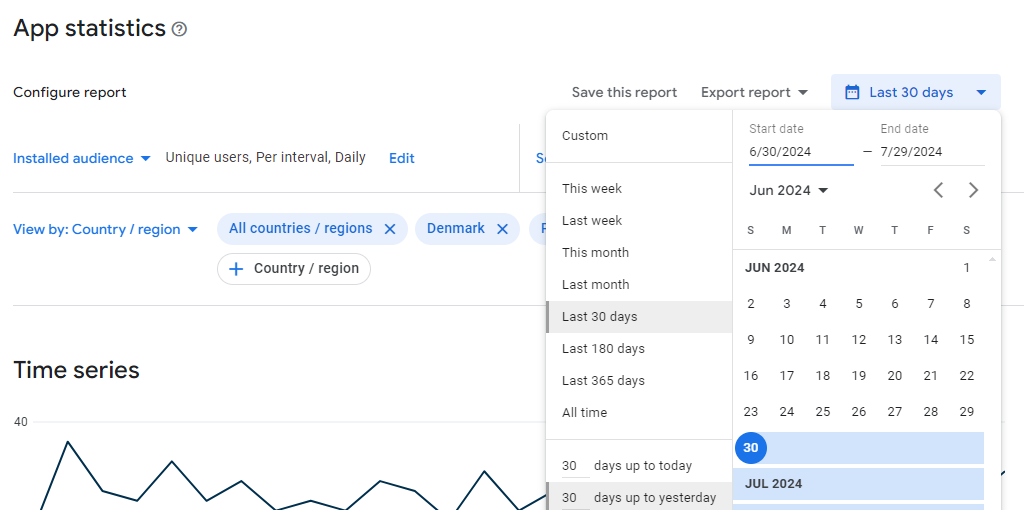
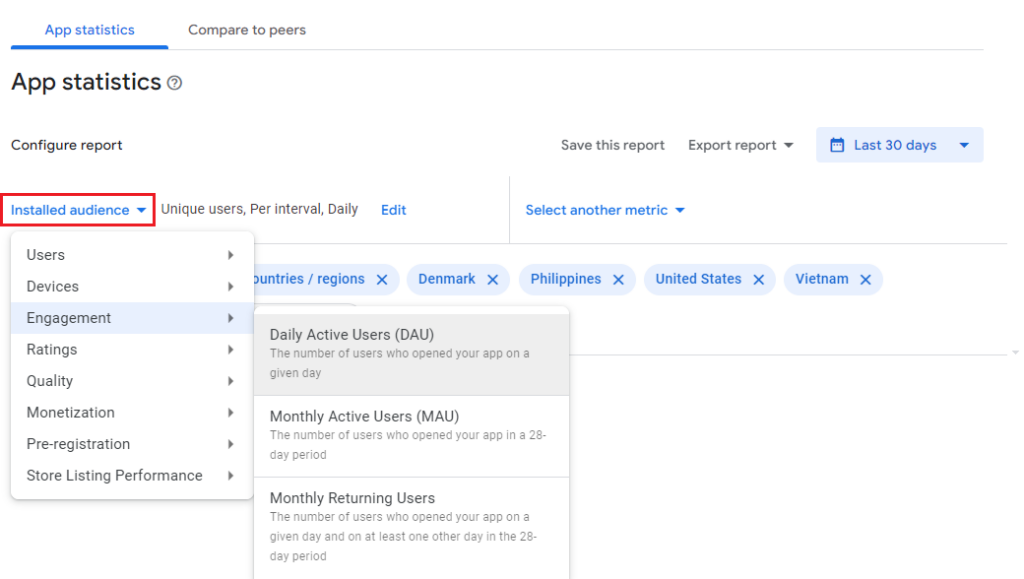
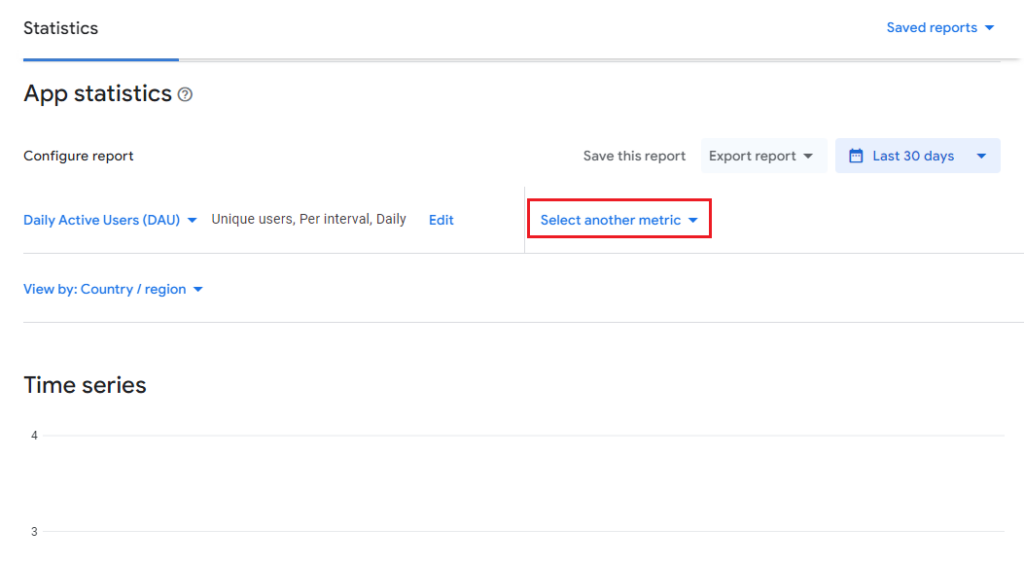
3. After that, select the metric you want to view.
Click the blue down arrow button beside the metric found in the “Configure report” section.
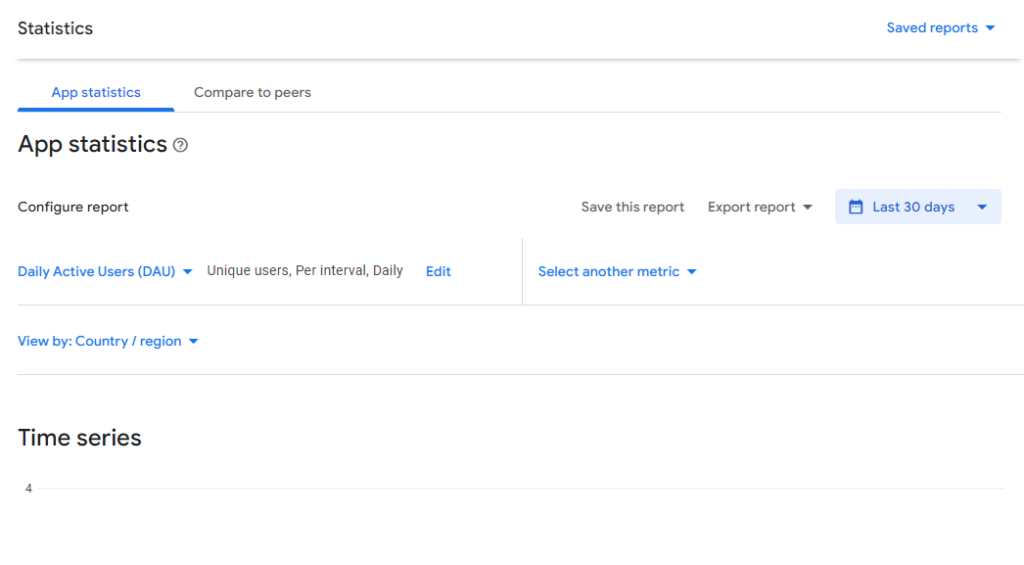
4. Next, define how the metric will be calculated and displayed.
After choosing a date range and metric, a digital marketer will define how it’ll be calculated and displayed.
5. Use the Metric calculation to specify how you want to calculate the data.
A digital marketing agency can use the Metric calculation to specify how to calculate selected data.
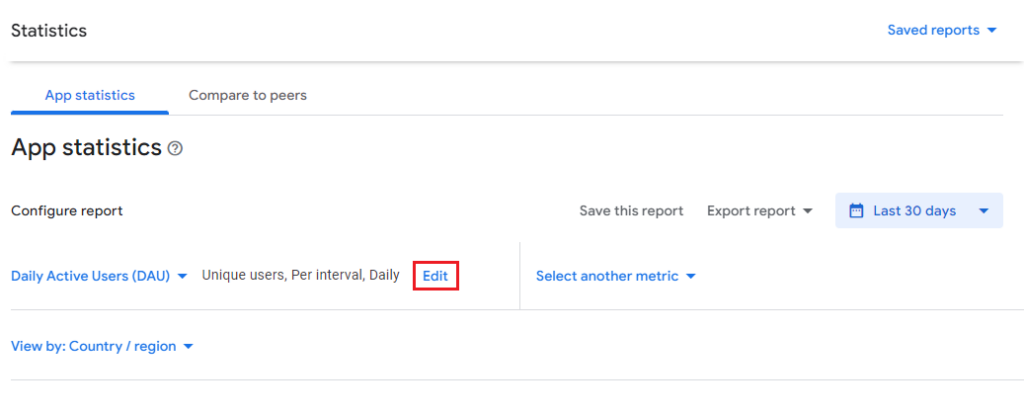
Digital marketers can click “Edit” to change how the metric will be calculated and displayed. Afterward, a popup will appear.
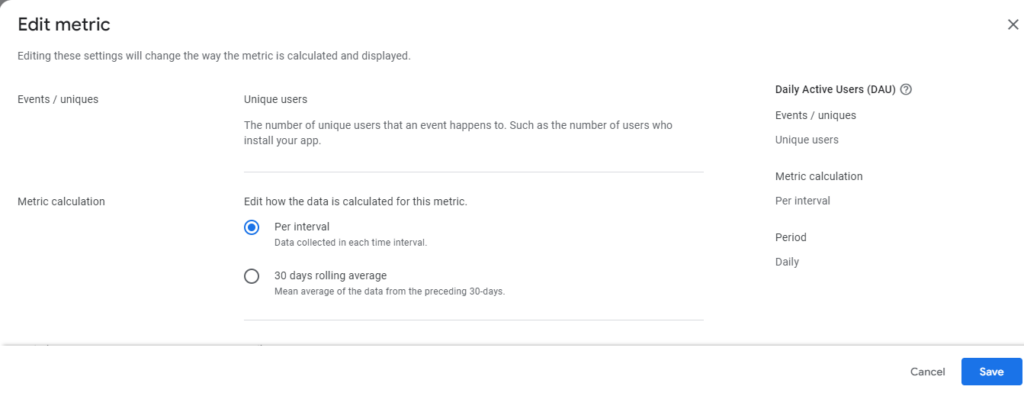
Moreover, a digital marketing agency can choose “Per interval” to calculate the data collected at every time interval. These include the number of users who install your app for the first time every month.
Alternatively, they can choose “30-day rolling average” to calculate the data collected from the last month.
6. Lastly, you can use Time intervals to specify the period from which you collect and calculate data.
Specific Time intervals include the following:
- Hourly;
- Daily;
- Weekly;
- Monthly, or
- Quarterly.
Additionally, you can create a second metric to make a comparison.
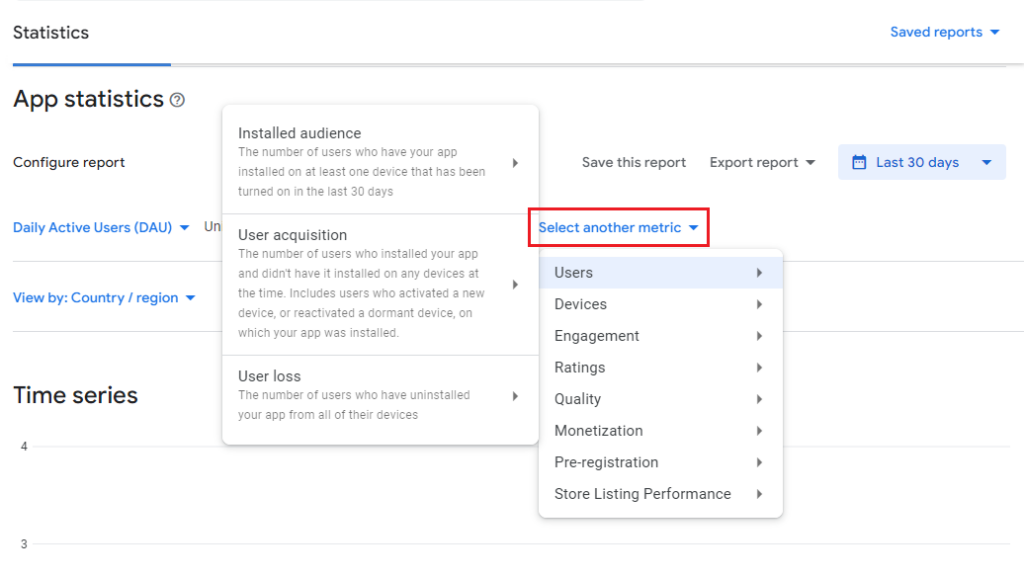
To create a second metric, click on the “Select another metric” button.
Then, click the down arrow button to select the dimensions you want to apply to said metric.
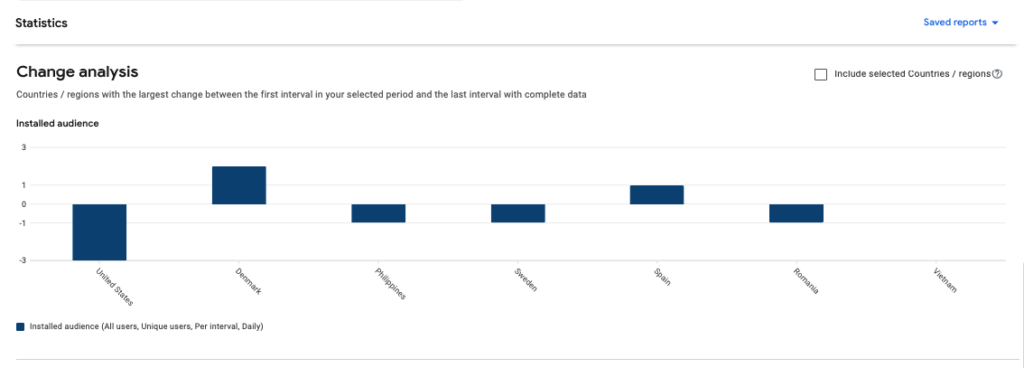
How to Select Your Dimensions
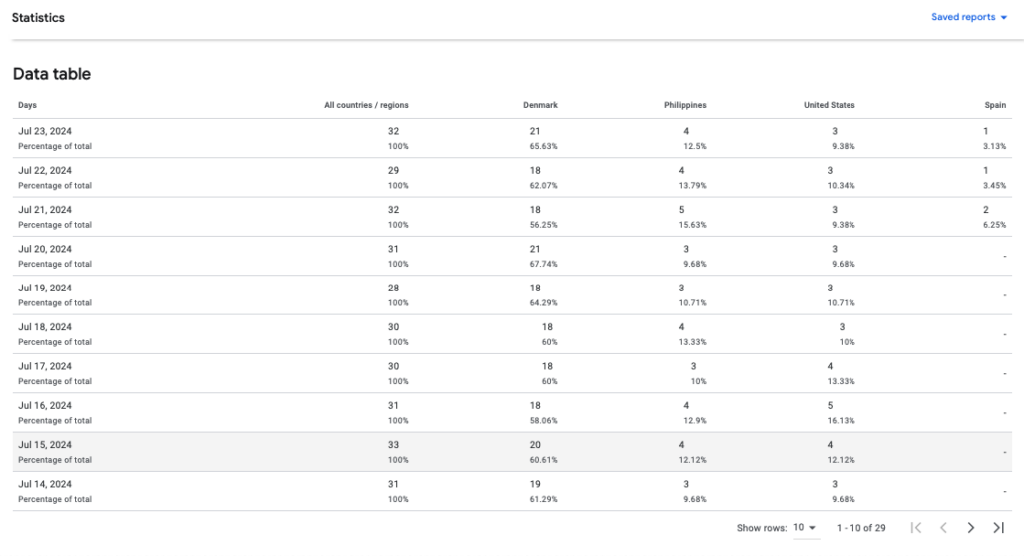
After you set up a report, the Google Play Console will display a table and a chart. This shows the mobile app performance for the selected period.
You can find the following dimensions on the Statistics page:
- Android version;
- Device;
- Country;
- Language;
- Carrier (when applicable);
- Channel, and
- App version.
How to Save, View, and Export Quick Reports
After setting up a report’s metrics and dimensions, Google Play Console allows you to save it for later use. To export your report, select the “Export report” button found beside “Save this report.” You can also personalize it with a title.
To view your reports, select “Saved reports” and then click on the Saved reports button. Afterward, click on the “Export report” button beside the title. The Google Play Console report will be exported as a CSV file.

Count On a Professional Digital Marketing Company to Analyze Your Mobile App Performance!
The Google Play Console platform equips businesses with the right analytical tools to determine your mobile app’s progress.
A trusted digital marketing agency can leverage the data to improve your advertising campaign. With the aid of dedicated professionals, you’ll experience a guaranteed increase in user downloads and installations!
Partner with a digital marketing company in the Philippines that can analyze app performance and manage your campaigns!
About Jalou Batilong
Most every great writer is a voracious reader, and no word describes Jalou better. Jalou enjoys a good read whenever she has the time to sit down and open a book or browse for interesting articles. It's through reading that she is able to digest information so easily, and write her own unique piece of information to share to everyone else.
- Find more about me on:


About Jalou Batilong
-
Find more about me on:
Related News:


How to Create eCommerce Product Pages That Sell

Why are Project Managers Important?


Comment 0